Mortgage Matters With Integrity
|
|
|
|
Written & Prepared by: Brian Tilton
|
|
|
|
|
Mortgage Insights:
30 Year Loan with Extra Principal Payments vs 20 Year or 15 Year Term
|
|
Insert elements with custom code
|
|
|
|
One of the most common mortgage questions we get is:
“Should I choose a shorter loan term—or stick with a 30-year and just pay extra when I can?”
It’s a great question, and the answer depends on your financial flexibility, risk tolerance, and long-term goals. Let’s break down the pros and cons of each approach and look at how they really impact your loan payoff and total interest costs.
Option 1: 30-Year Loan + Extra Principal Payments
Pros:
- Lower required payment: Your monthly obligation is lower, giving you more flexibility in tight months.
- Optional acceleration: You can make additional principal payments anytime, cutting down interest and shortening the loan term— on your own terms .
- Liquidity advantage: You can divert funds elsewhere (savings, investments, emergencies) when needed.
- More control: You decide when to be aggressive or conservative with your finances.
Cons:
30-year loans typically have rates 0.25–0.75% higher than 15- or 20-year options.
- Temptation to not prepay: If extra payments aren’t made consistently, you may end up paying significantly more in interest over time.
- Longer actual term unless disciplined: Without a plan, the full 30-year duration may quietly pass by.
|
| Feature |
Home Equity Loan |
HELOC |
| Type of Rate |
Fixed |
Variable |
| Disbursement |
Lump sum at closing |
Draw funds as needed |
| Payment Type |
Fixed monthly payments |
Interest-only during draw period |
| Best For |
One-time large expenses (e.g. remodel) |
Flexible or phased spending |
| Rate Volatility |
None – fixed for life of loan |
May rise with market rates |
|
The table below shows a comparison of monthly savings when choosing between two options for accessing cash: refinancing your existing low-rate mortgage or keeping your current mortgage and obtaining a home equity loan.
Assumptions:
- Current loan balance: $500,000
- Current interest rate: 3.00%
- Cash-out desired: $100,000
|
| Option |
Current Loan Amount |
Cash-Out Amount |
New Loan Amount |
Current Interest Rate |
New Interest Rate |
Effective Rate |
Monthly Payment |
Monthly Savings |
| Refinance Entire Loan |
$500,000 |
$100,000 |
$600,000 |
3.00% |
6.25% |
6.25% |
$3,695 |
— |
| Keep Current Loan + $100k HELOAN |
$500,000 |
$100,000 |
$100,000 |
3.00% |
7.50% |
3.75% |
$2,807 |
$888 |
|
|
|
|
|
|
When Might a Home Equity Loan or HELOC Make Sense?
- 🏚️ Home improvements that boost property value
- 💳 Consolidating high-interest credit card debt
- 🎓 Covering college tuition or major life events
- 💼 Starting a business or side hustle
- 🆘 Emergency reserves — just in case
Other Things Borrowers Should Know
- 💡 Interest may be tax-deductible if used for qualified home improvements (check with your tax advisor) .
- 🏦 You can generally borrow up to 80% of your home’s value minus your current loan balance.
- 📈 Home equity products can help bridge financial goals without disrupting your low first mortgage rate.
|
|
|
|
|
|
|
|
|
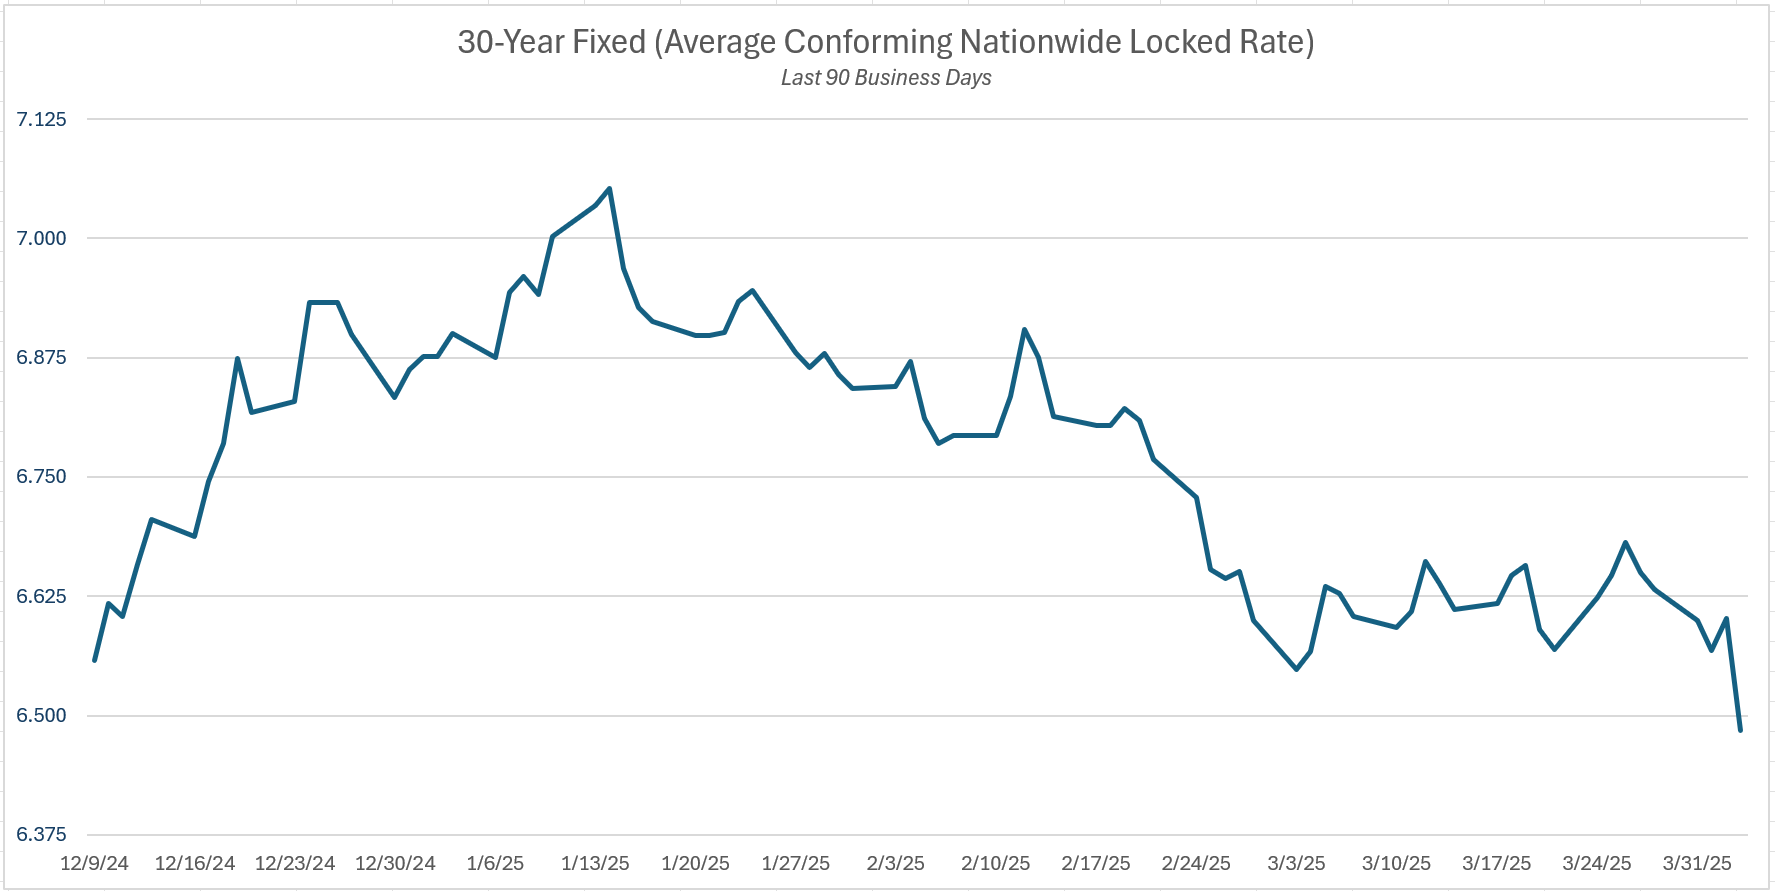
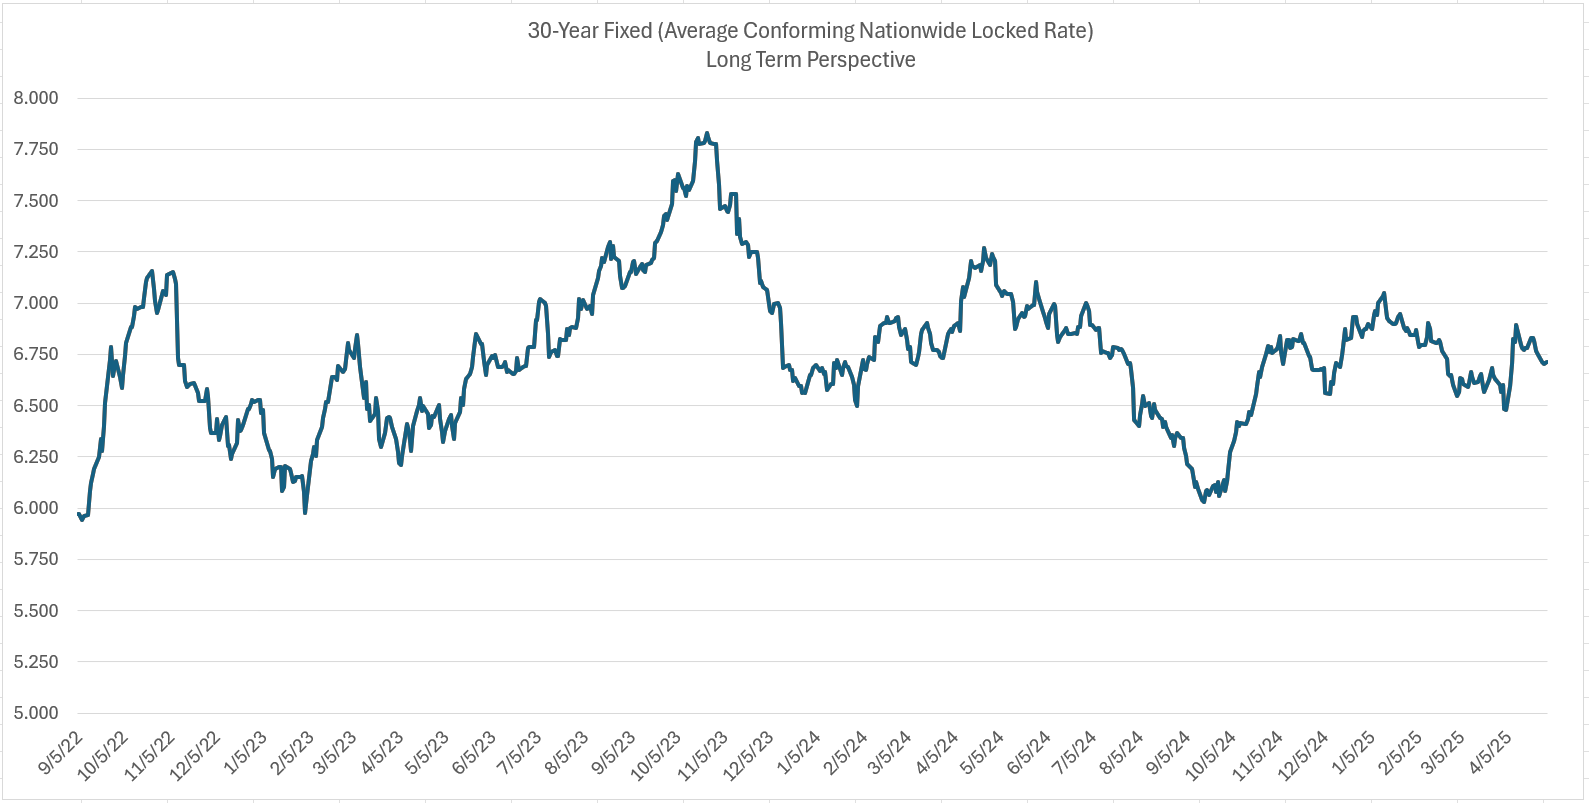
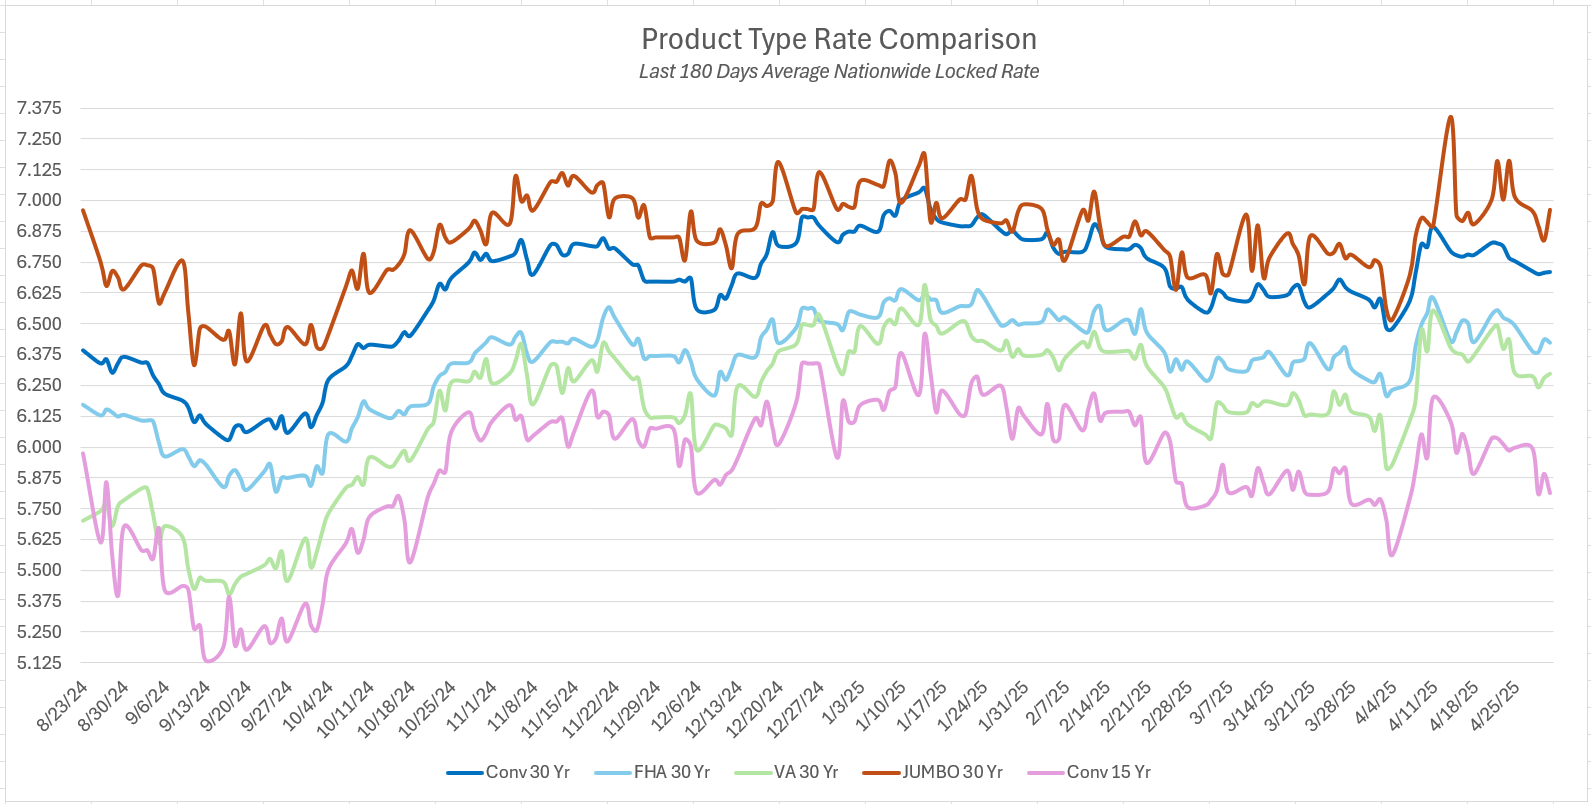
After a turbulent April, mortgage rates experienced a modest decline in the first week of May. The average 30-year fixed-rate mortgage dipped approximately 0.07%, compared with the previous week. This downward trend is consistent with the 10-year Treasury yield, which settled at 4.33% by week’s end. Volatility was comparatively subdued, due to the absence of headline news; though this could change at a moment’s notice.
Looking ahead to next week, the market’s focus continues to be on tariffs and inflation concerns. Its a foregone conclusion that the Federal Reserve will keep the fed funds rate unchanged at Wednesday’s FOMC meeting, but comments made by fed members will be closely scrutinized and could move markets in either direction – so be on your toes.
|
|
|
|
|
|
|
|
|
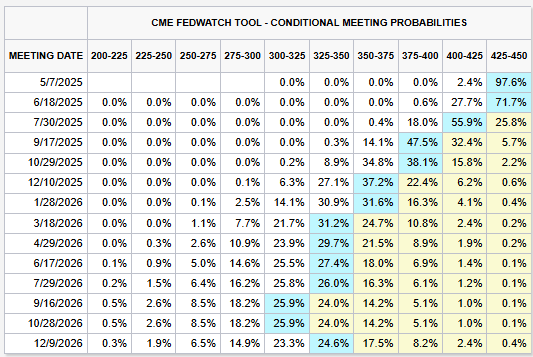
As of today, financial markets are pricing in a paltry 3.2% probability of a 25 basis point cut in the Fed Funds rate at the next Fed meeting; therefore a 96.8% probability of my change. Looking further out to the June 18th FOMC meeting, the market is pricing in a 35.6 probability of a 25 basis point cut, and a 1.1% probability of a 50 basis point cut.
Key factors fueling this shift in probabilities include:
🔥 Sticky Inflation Readings
-
Recent CPI and PCE reports showed inflation cooling slower than expected, particularly in services like housing and insurance.
-
This signals the Fed may need to keep rates higher for longer, delaying cuts borrowers have been hoping for.
📈 Strong Labor Market Data
-
Job growth remains surprisingly resilient, with unemployment holding near historic lows and wages continuing to rise.
-
The Fed sees a strong job market as evidence the economy isn’t cooling enough to justify rate cuts.
💬 Hawkish Fed Commentary
📉 GDP Revisions and Consumer Spending
-
While growth has slowed somewhat, recent GDP and retail data show the U.S. consumer is still spending steadily.
-
That strength may delay the Fed’s urgency to stimulate the economy by cutting rates.
📊 Shifts in Market-Based Rate Bets
-
Traders have sharply adjusted rate cut bets. As of this week, markets are pricing in just one or two cuts in 2025, compared to the six cuts expected at the start of the year.
-
Mortgage rates often move ahead of the Fed, so these expectations are already impacting borrower pricing.
🌎 Global Macro Risks (or Lack Thereof)
|
|
|
Next FOMC Meeting: Wednesday, May 7
Current Fed Funds Rate Range: 4.25% – 4.50%
|
 |
|
|
 |
|
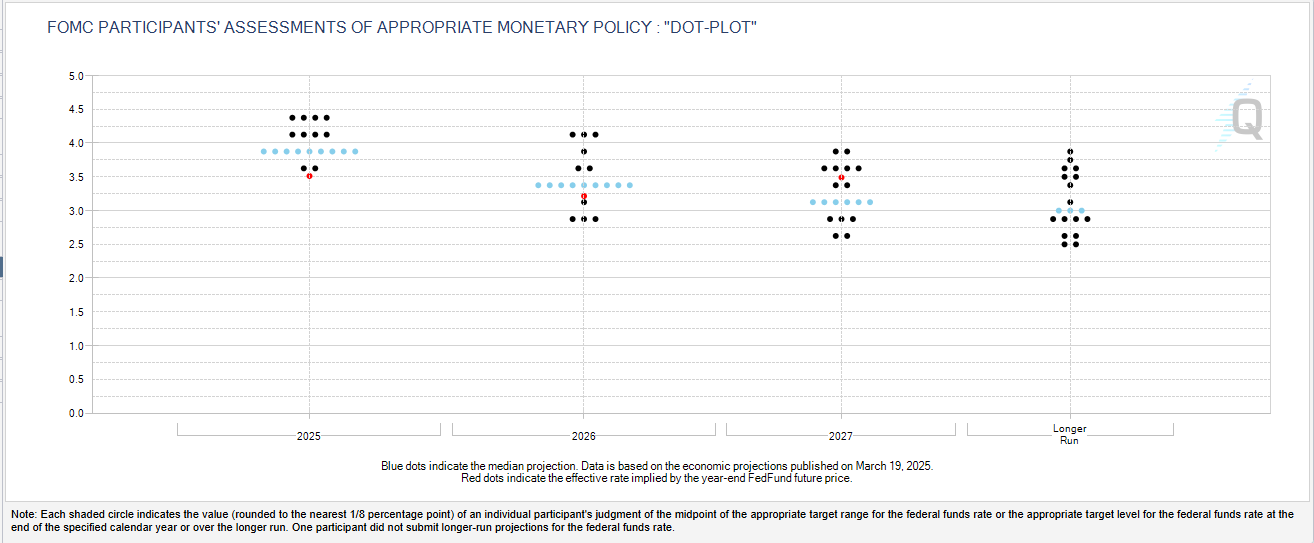
How to Read the Fed’s Dot Plot (chart below)
● Each dot represents one FOMC member’s forecast.
● There are 19 participants in the dot plot:
-
▪︎ 7 Fed Board Governors (nominated by the President and confirmed by the Senate
-
▪︎ 12 Regional Fed Bank Presidents
● The red dot shows the market’s forecast, based on the price where futures are trading.
● The blue dots represent the median forecast.
● The greater the dispersion in the dots, the less consensus between the partipants.
Usefulness for Borrowers: Provides an educated indication of where the Fed Funds rate may be in future years.
|
|
|
|
|
|
|
|
Question: Why should I stay abreast of upcoming economic news?
Answer: Financial markets react to disparities between expected versus actual economic data. On days where highly anticipated economic data is released there is a greater likelihood of heightened volatility (risk). This is particularly relevant if you are locking it a rate.
|
|
|
|
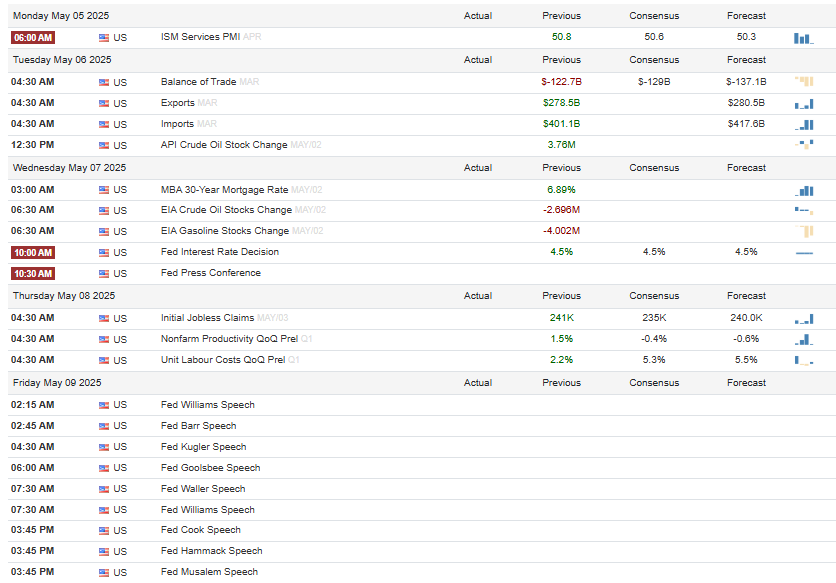
Here’s a rundown of this week’s key economic data being released — what’s coming & why it matters:
What: ISM Services PMI This report measures the health of the service sector, which makes up about 70% of the U.S. economy.
When: Monday, May 6th – 7:00 AM PST
Market’s Expectation: 52.0 (down slightly from last month)
What to Watch for: A reading above 50 = growth. If it comes in hotter than expected, it could signal that inflation pressures remain stubborn. Why it matters: Strong services = less urgency for the Fed to cut rates, and that can push mortgage rates higher.
What: Jobless Claims
When: Thursday, May 9 – 5:30 AM PST
Market’s Expectation: Initial claims are projected at 225K, up slightly from last week’s number of 219K.
What to Watch for: If claims drop lower than expected, it reinforces the Fed’s view that the economy is strong — and that means higher-for-longer rates. A softening job market, however, could nudge mortgage rates down as Fed cut bets gain steam.
What: Consumer Sentiment (University of Michigan – Preliminary). This survey tells us how consumers feel about the economy, jobs, and inflation.
When: Friday, May 10 – 7:00 AM PST
Market’s Expectation: 76.0
What to Watch for: The spotlight will be on the 1-year inflation expectation component — if consumers expect prices to rise, the Fed pays close attention. Rising expectations = bad news for rate cuts. Stable or falling expectations = mortgage-rate friendly.
|
|
|
|
|
|
|
Understanding Seasonality in the California Housing Market:
What Buyers and Sellers Need to Know
When it comes to real estate, timing matters—but not always in the way people think. One of the most overlooked yet influential factors in the housing market is seasonality, and California is no exception. Whether you’re buying, selling, or just keeping an eye on mortgage rates, understanding seasonal patterns can give you a serious edge.
Spring and Summer: Prime Time for Inventory and Activity
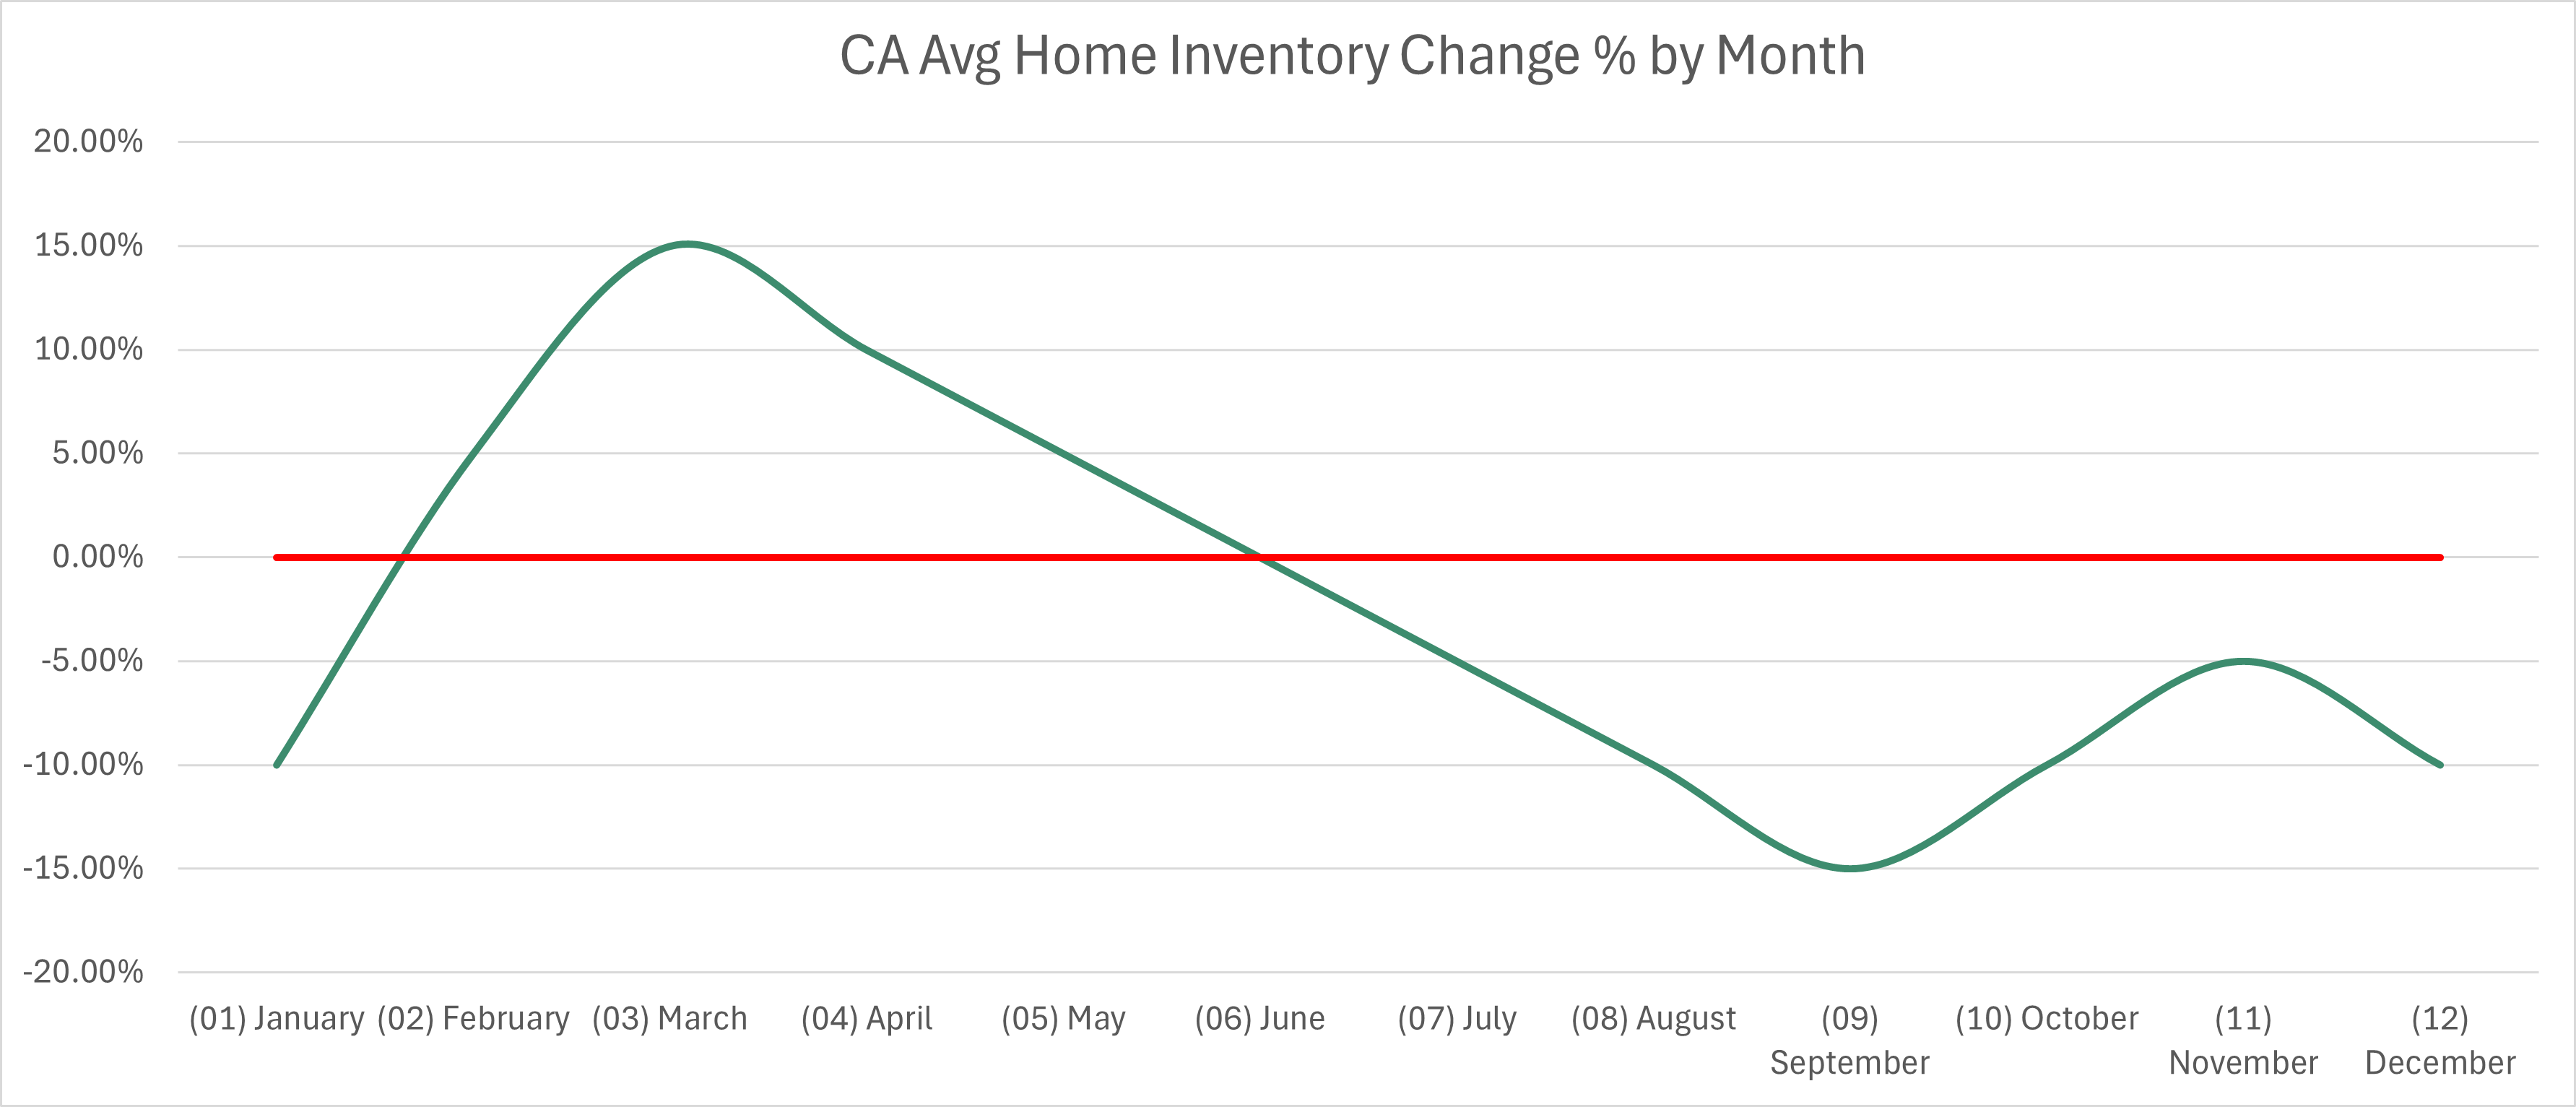
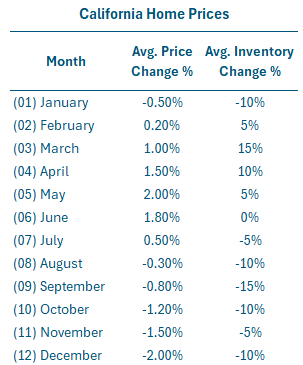
Historically, California sees a clear increase in both listings and buyer demand starting in March and peaking between May and July. This is when inventory rises 20–40% in many markets compared to winter months. Buyers come out in force, families plan moves around the school year, and the weather favors home showings and open houses.
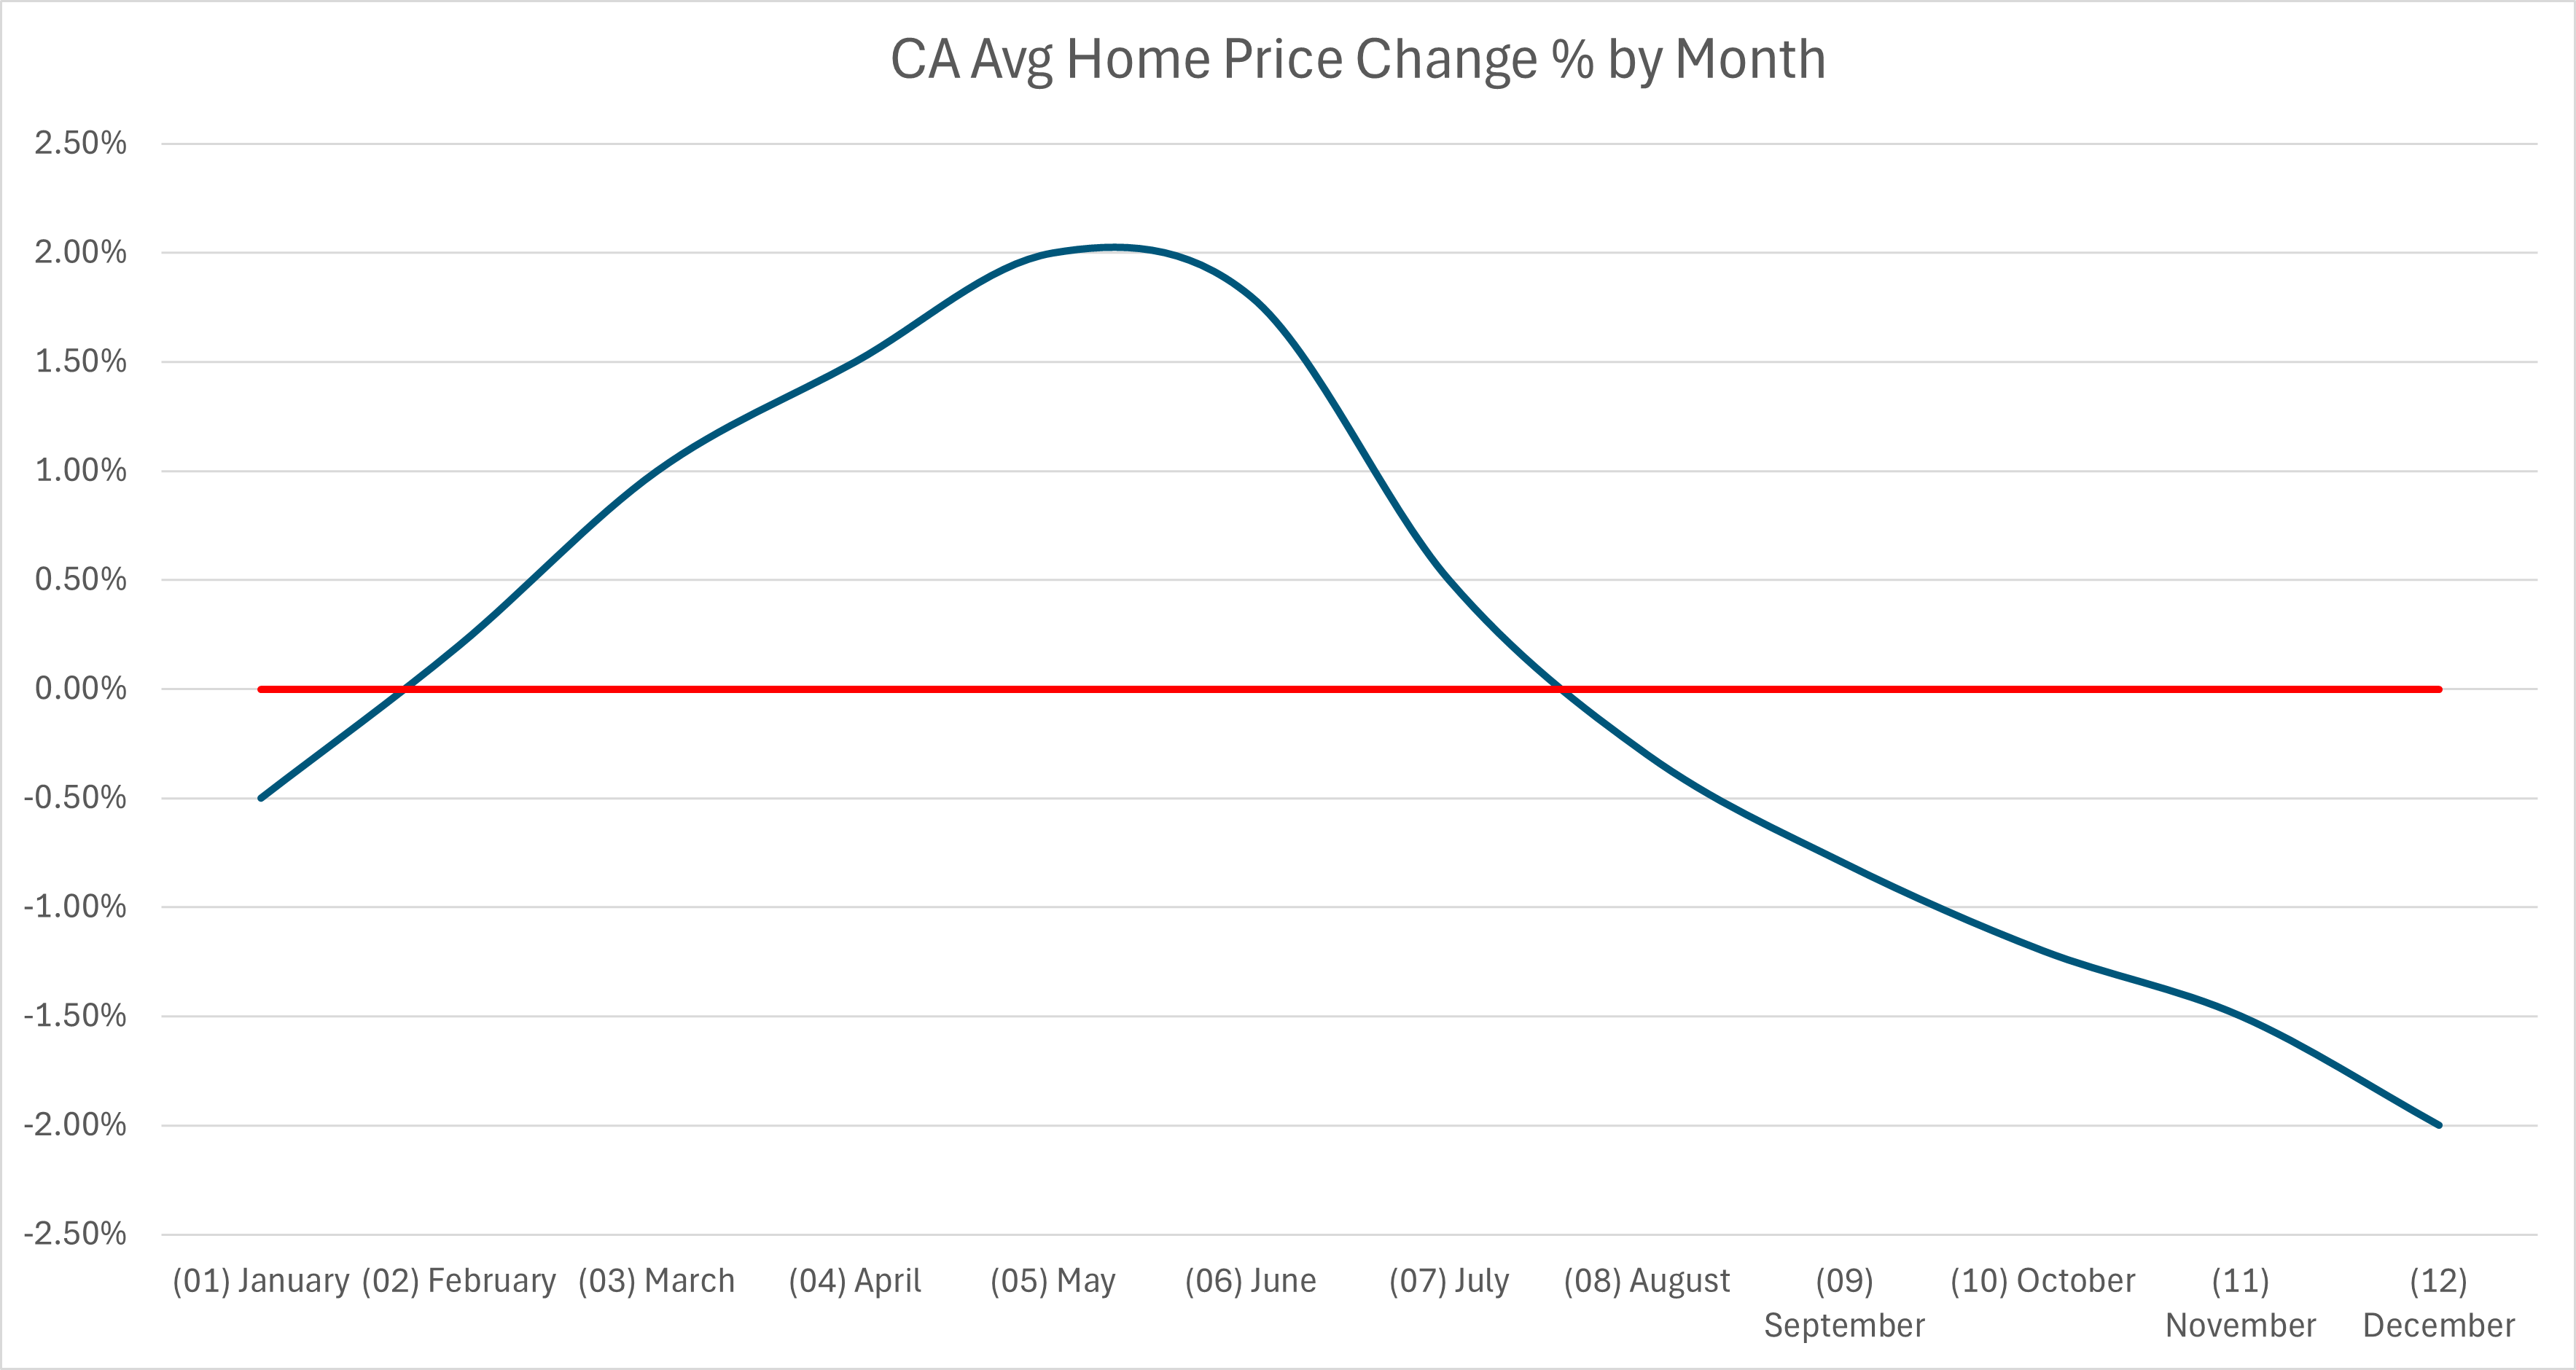
With this spike in activity, home prices often rise faster during the spring and early summer months—not because of seasonality alone, but because demand surges. In competitive markets like Orange County, San Diego, and the Bay Area, this can mean multiple-offer situations and bidding wars, particularly for well-priced homes.
Fall and Winter: Less Competition, Fewer Options
By late September through the holidays, listings drop off significantly. Many homeowners pull unsold properties off the market, and new listings slow. Inventory typically dips by 25–50% from summer highs, depending on the region.
This seasonal lull can benefit buyers looking to avoid peak-season competition. Sellers are fewer, but often more motivated—especially in Q4 when closings before year-end become a priority. However, choices are limited, and days on market may stretch out unless pricing is aggressive.
How Significant—and Reliable—is Seasonality?
Seasonal patterns are remarkably consistent year over year, especially in suburban and family-oriented markets. The spring surge and winter dip repeat like clockwork, even when broader market conditions (like rates or inventory shocks) change.
That said, the magnitude of seasonal shifts can vary:
-
In a hot seller’s market (low inventory, high demand), seasonality may just moderate how fast prices rise.
-
In a cooling or buyer’s market, seasonal lows can lead to deeper price cuts or more incentives.
-
In high-demand metros like San Francisco or LA, seasonality has a smaller impact on price direction but can still affect how long homes stay on the market.
So while seasonality is predictable, its effect is always layered on top of the underlying trend in the market.
To visually put the impact of seasonality into perspective, the charts and table below show the inter-month relative impact.
|
|
|
|
|
Why Seasonality Affects the Rate of Change, Not Direction
Here’s the key: seasonality doesn’t drive long-term market fundamentals—it temporarily affects how those fundamentals play out.
The direction of the housing market—whether prices are rising, flat, or falling—is primarily determined by:
-
Interest rates
-
Job growth and wage trends
-
Housing supply and new construction
-
Demographics (migration, household formation, etc.)
-
Lending standards
These are macro-level drivers that evolve over quarters and years. Seasonality, on the other hand, is short-term and cyclical. It simply affects how those broader forces are expressed month to month.
For example:
-
In a rising market (strong demand, low inventory), prices will likely continue upward year-round, but appreciation accelerates in spring and tapers in winter.
-
In a declining market (high rates, soft demand), prices may fall regardless of season, but price drops may slow in spring as activity picks up, then accelerate again in fall or winter.
Why This Matters for You
-
Buyers: Know when inventory is likely to peak (spring/summer) and when you may have more negotiating power (fall/winter). If you’re picky about location or features, spring offers more selection. If you’re budget-conscious, winter may offer better deals.
-
Sellers: Listing in spring gets more eyeballs, but off-season listings can attract more serious, less distracted buyers—and may close with fewer contingencies if priced right.
-
Borrowers: From a mortgage standpoint, off-peak seasons can offer faster underwriting and closings due to lower lender and title company volume. Additionally, watching how rates move in tandem with seasonal demand gives you a chance to lock at a favorable moment.
Bottom Line
California real estate follows a consistent seasonal rhythm—stronger activity and inventory in spring and summer, slower movement in fall and winter. But remember: seasonality shapes the pace, not the direction, of the market.
It doesn’t matter how favorable the season is—you can’t sell into strength that isn’t there, and you won’t find deep discounts if the overall market is surging. Seasonality adjusts the speed and intensity of market conditions already in place.
Knowing when to act isn’t just about chasing prices—it’s about understanding the tempo of the market so you can make smart, informed decisions whether you’re buying, selling, or refinancing.
|
|
|
|
|
|
|