Mortgage Matters With Integrity
|
|
|
|
Written & Prepared by: Brian Tilton
|
|
|
|
|
|
|
|
Down Payment Assistance in California:
What Every Homebuyer Needs to Know
|
|
|
|
If you’re feeling priced out of California’s expensive housing market, you’re not alone—But did you know there are first-time homebuyer programs that can significantly reduce or even eliminate your down payment and closing costs?
An astonishing number of Down Payment Assistance (DPA) programs offer thousands—or even tens of thousands—of dollars through deferred-payment loans, low or no-interest loans, and in some cases forgivable loans or grants. These subsidized and non-profit programs can make the dream of home ownership a reality for buyers who qualify and who work with lenders who know where to look.
Here’s the insider’s guide to how these programs work, who qualifies, and why it might be one of the smartest financial moves you can make.
What Is Down Payment Assistance (DPA)?
A Down Payment Assistance program helps homebuyers cover their initial down payment and often closing costs—making the upfront hurdle of homeownership easier or, in some cases, almost disappear.
-
How it works: DPA is typically delivered as a second or third-lien loan (behind your main first-lien mortgage), a grant, or in some cases an entirely forgivable loan. Let’s break down this terminology in more detail.
-
First lien loan: Your main mortgage remains a standard loan—most often FHA, VA, or conventional—while the DPA sits “behind” it as support.
-
Grant
-
What it is: Free money—a cash gift to help cover your down payment or closing costs.
-
Repayment: Never repaid; no lien on your property.
-
Example: If you receive a $10,000 grant, you simply use it at closing like part of your own savings.
-
Forgivable Loan
-
What it is: Usually a second lien loan, but the best part is, if you follow the rules (usually living in the home for 3–5 years), the debt disappears.
-
Repayment: If you meet program terms (such as owner-occupancy for required years), you owe nothing back. Move or refinance early and you might owe a prorated amount
-
Second or Third Lien (Subordinate Loan)
-
What it is: A loan from the DPA program, recorded after your main (first lien) mortgage. It may be deferred (no payments until you sell/refi), or require payment with low or no interest. (Terms vary depending on the specific DPA program)
-
Repayment: Varies by program. Some have no payments and 0% interest. Usually paidt back only if/when you sell or refinance.
Where Does the Money Come From?
Most DPA programs draw on funds provided by:
-
State housing finance agencies
-
Local government or municipal housing funds
-
Federal block grants
-
Nonprofit or employer partnerships
These programs use dedicated housing funds, state bond proceeds, and even re-invested repayments from previous DPA recipients. It’s a win-win scenario—homebuyers benefit from a highly attractive “subsidy”, while the agencies and municipalities make an investment in stable communities that serves the public best interest.
Who Are These Programs Intended For?
Most California DPAs target first-time homebuyers but there are exceptions. Typical intended beneficiaries include:
-
Low to Moderate income Californians
-
Renters who haven’t owned a home in the last three years
-
Teachers, first responders, or “community heroes”
-
Buyers in specific target areas
Income, Geographic, and Qualifying Limits
Contrary to popular perception, income and eligibility boundaries are surprisingly broad. (This next section is in generalities since each DPA program is slightly different.)
Forgivable Loans, Deferred Interest, and What They Mean
-
Forgivable loans: If program conditions are satisfied (such as living in the home for 5 years), the DPA may be fully forgiven—meaning you keep the money with no repayment.
-
Deferred interest: Many DPA loans have 0% interest and no payments until you sell your home, refinance, or pay off your primary mortgage. Some accrue interest in the background; others remain completely interest-free during the deferred period.
Restrictions On Selling, Refinancing, or Occupancy
-
Home Sale/Refinance: Most DPA require repayment upon selling the home, transferring title, or refinancing the first mortgage.
-
Primary residence: You must occupy the property as your principal residence, usually for 3–5 years minimum (sometimes longer for full forgiveness). Second homes and investment properties are not eligible.
-
No “flipping”: Buying and selling quickly isn’t allowed. Violating terms usually means repaying the assistance in full (plus deferred interest, if applicable).
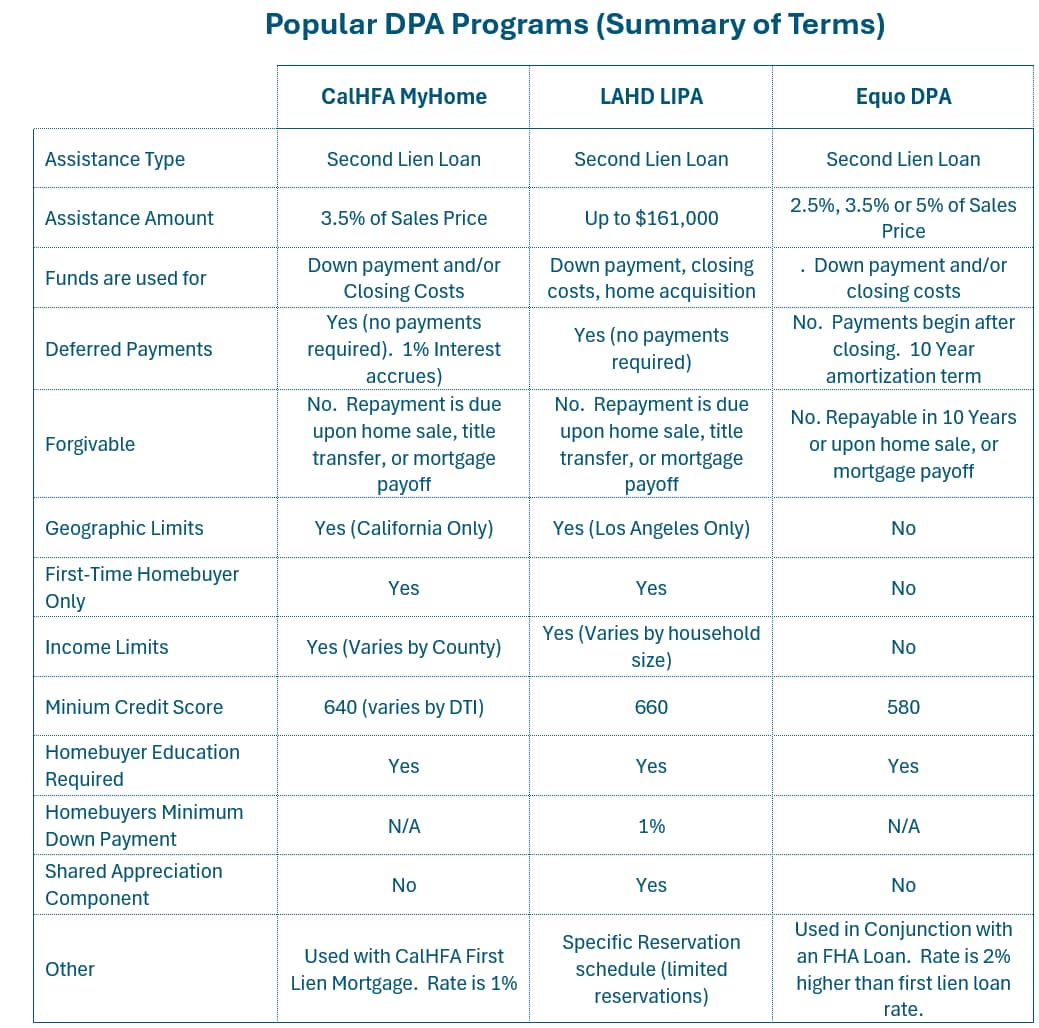
A Few Notable DPA Programs to Explore
-
CalHFA MyHome Assistance: Up to 3.5% of the purchase price or appraised value toward down payment/closing costs—as much as $21,000 on a $600,000 home.
-
Municipal Programs (e.g., LAHD LIPA, MIPA): Grants or 0% interest loans from $7,500 up to $90,000+ per eligible household, and often no monthly payment required for years!
-
EQUO DPA: Up to 5% of the loan amount for down payment/closing cost support.
|
 |
|
|
|
Eye-Opening Facts for Borrowers
-
You don’t need to be low-income: “Moderate” income can still qualify—six-figure earners in many parts of California are eligible.
-
Homebuyer education is a simple task: Most programs require a low-cost or free course. Completion may open the door to tens of thousands in benefits.
-
You don’t always have to be a first-time buyer: Some programs allow exceptions for those who haven’t owned in the last three years or for buyers in certain “targeted” areas.
-
You can often combine DPA programs—stacking state, city, and sometimes employer-sponsored DPA for even more assistance.
The Bottom Line: Don’t Miss Out on this Lucrative Homebuying Support!
If you’re thinking about buying, you owe it to yourself to investigate Down Payment Assistance. California offers more—and larger—programs than almost any other state. The right strategy can drop your up-front costs dramatically, and for some, transform “impossible” into “achievable.”
Curious what you qualify for? Let us run the numbers—Integrity Capital Mortgage proudly offers access to CalHFA programs, EQUO DPA, LAHP LIPA, and MIPA, and many more. We will match you to the maximum assistance available for your scenario.
|
|
|
|
|
|
|
|
|
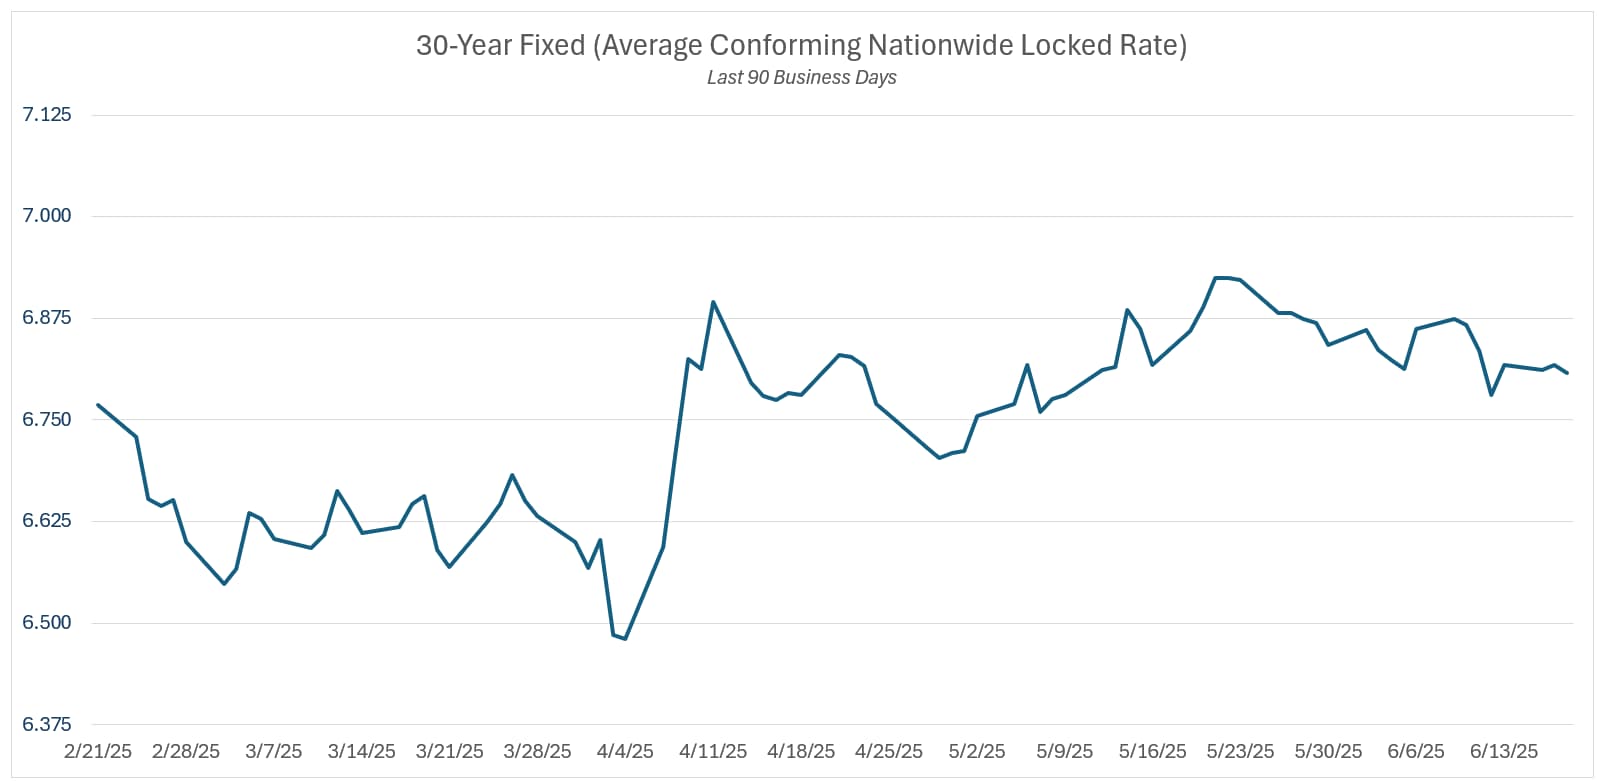
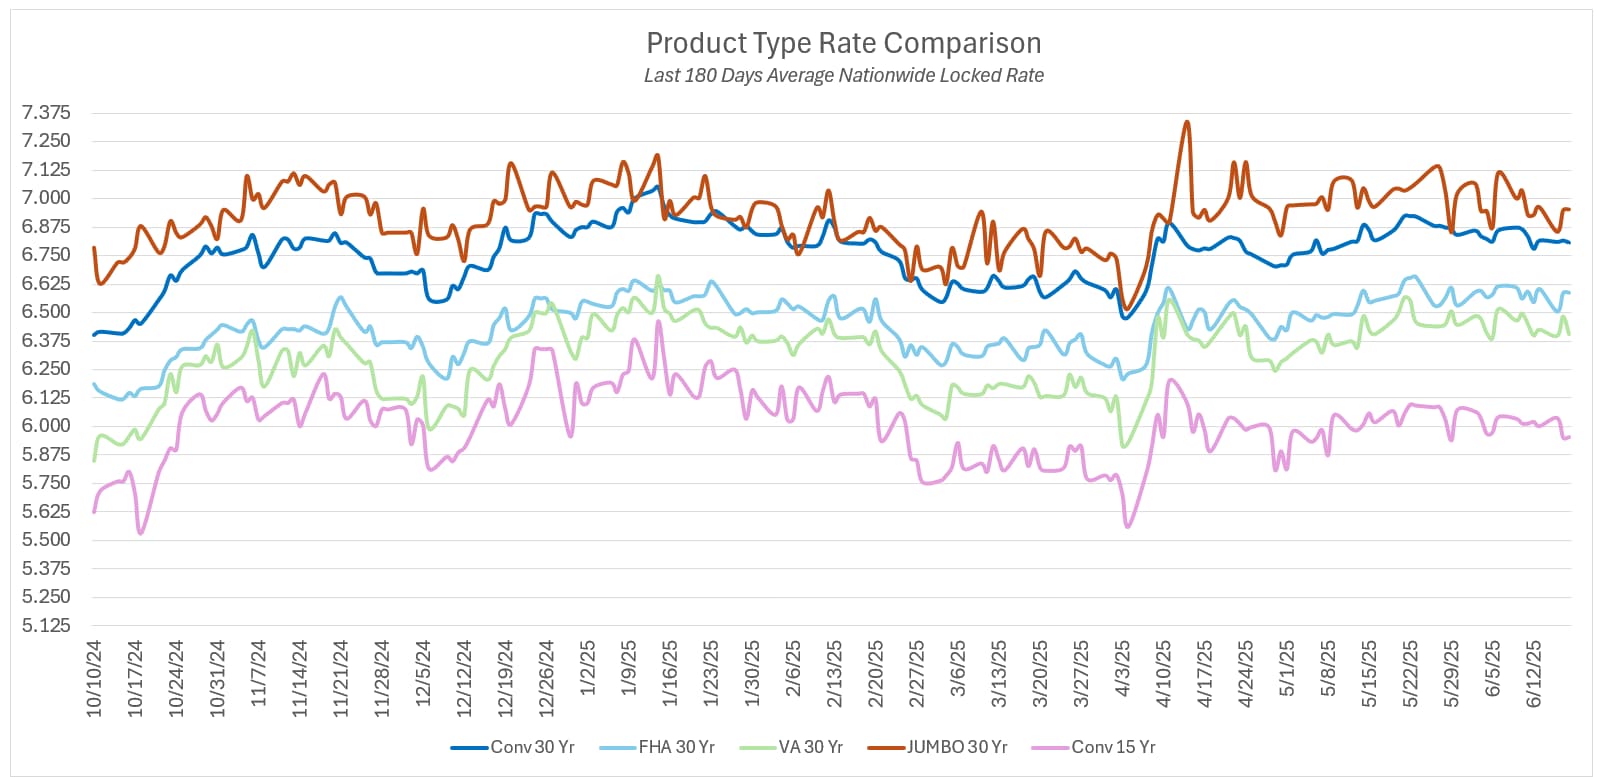
Homebuyers and borrowers are finally getting some long awaited relief in interest rates. Here’s how rates moved across loan categories since the prior newsletter circulation date, measured in basis points (bps, where 100 bps = 1%):
-
30-Year Fixed Conventional: -20 bps
-
15-Year Fixed Conventional: -15 bps
-
30-Year Fixed FHA: -15 bps
-
30-Year Fixed VA: -15 bps
-
5/6 ARM: -10 bps
Mortgages vs. Treasuries: Market Dynamics
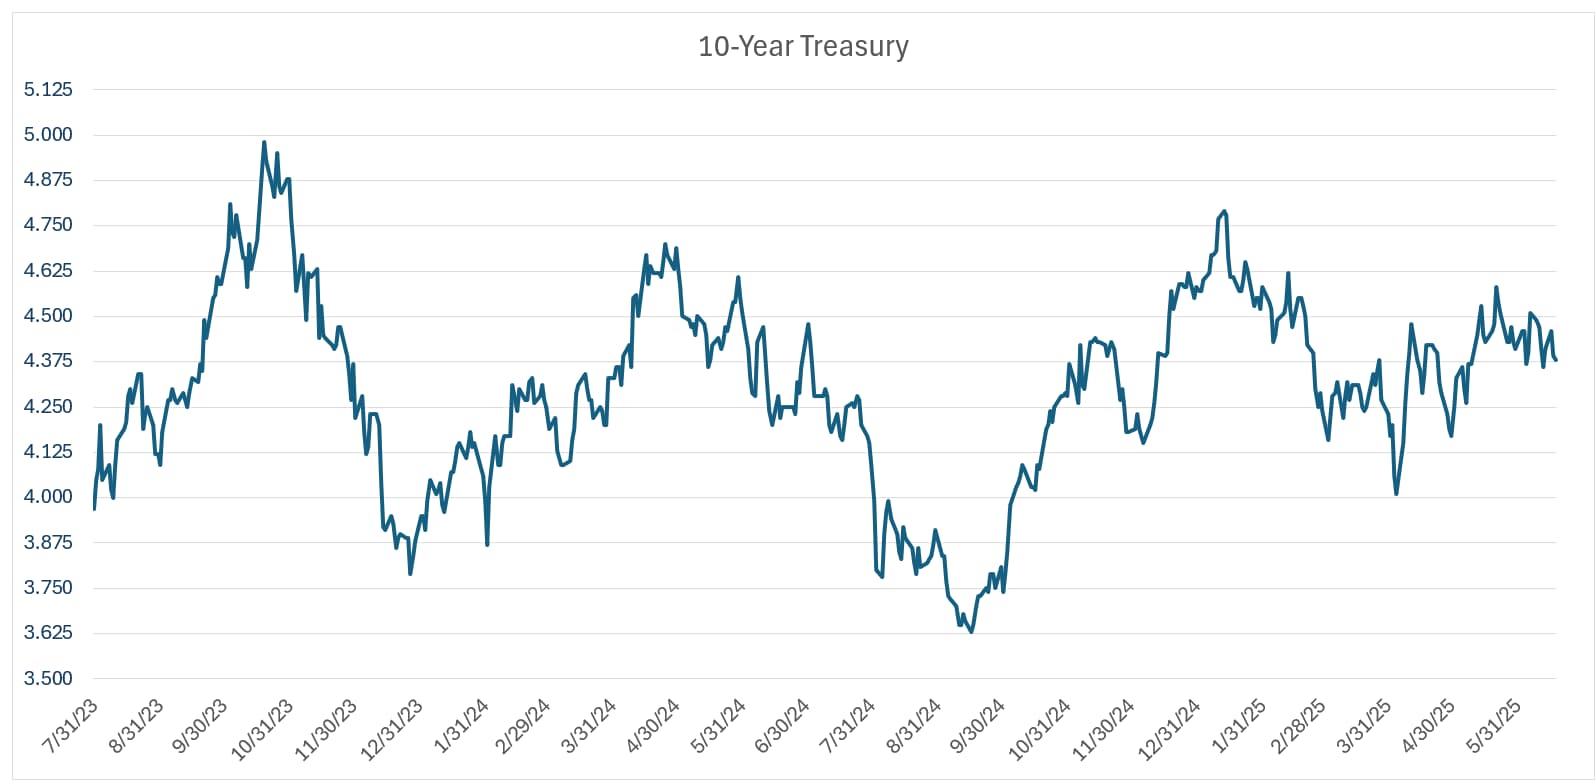
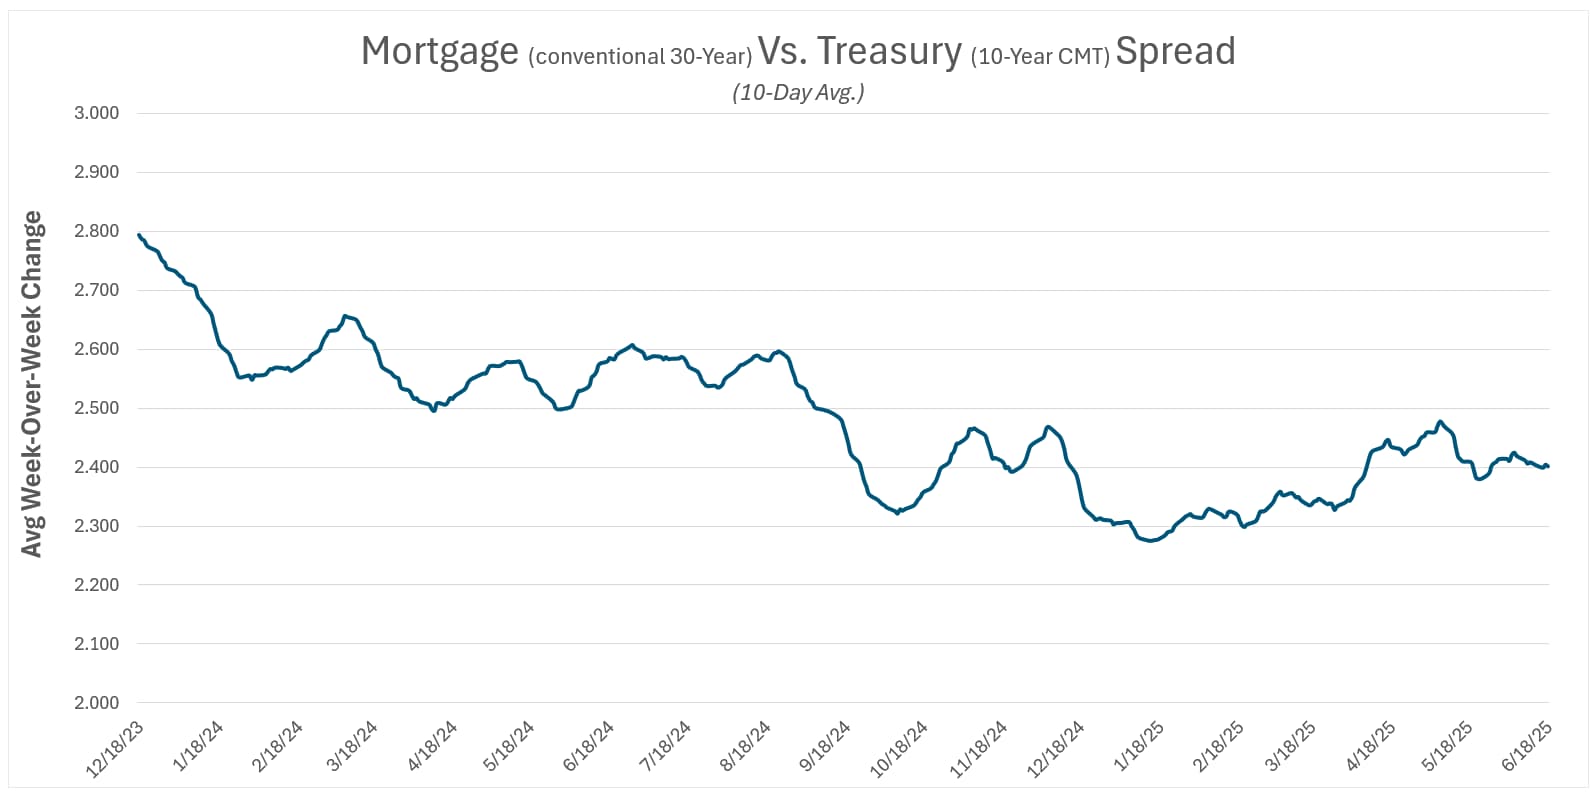
Mortgage rates are closely tied to U.S. Treasury yields, which act like the heartbeat of the bond market. The 10-year Treasury fell by around 0.25 points, while the 2-year (more influential for ARMs) dropped by about 0.15 points. When investors get jittery about the economy, they flock to safe-haven Treasuries, driving yields down—and mortgage rates tag along for the ride. In this case, softer economic signals (more on that below) sparked a buying spree in bonds, pulling rates lower. Mortgages didn’t outperform or underperform Treasuries significantly; instead, the spread between them stayed steady.
Yield Curve Shifts
For much of the past couple of years, the yield curve was “inverted” (short-term yields higher than long-term, signaling potential economic slowdowns). But in 2025, it’s normalized, with longer-term yields now modestly higher than short-term ones (e.g., 10-year about 0.50 to 0.60 points above the 2-year). This bull steepening suggests markets are betting on growth ahead, but with recent dips across the board, it’s benefiting all mortgage types. Fixed-rate loans, pegged to longer-term yields, have seen slightly more relief than ARMs (tied to shorter-term rates), as long-term expectations for Fed cuts have improved faster.
Causes of Rate Changes
The main hero of the story is a mix of economic data signaling a slowdown, ramping up expectations for Federal Reserve rate cuts as soon as September. In particular, July’s employment numbers came in softer than expected, with fewer jobs added and unemployment ticking up. This lit a fire under bond markets, as investors bet the Fed would slash rates to stimulate growth. Also, recent CPI and PCE reports showed inflation edging toward the Fed’s 2% target. Less price pressure means less need for high rates to combat it, so markets adjusted accordingly.
Longer-Term Trends: Zooming Out
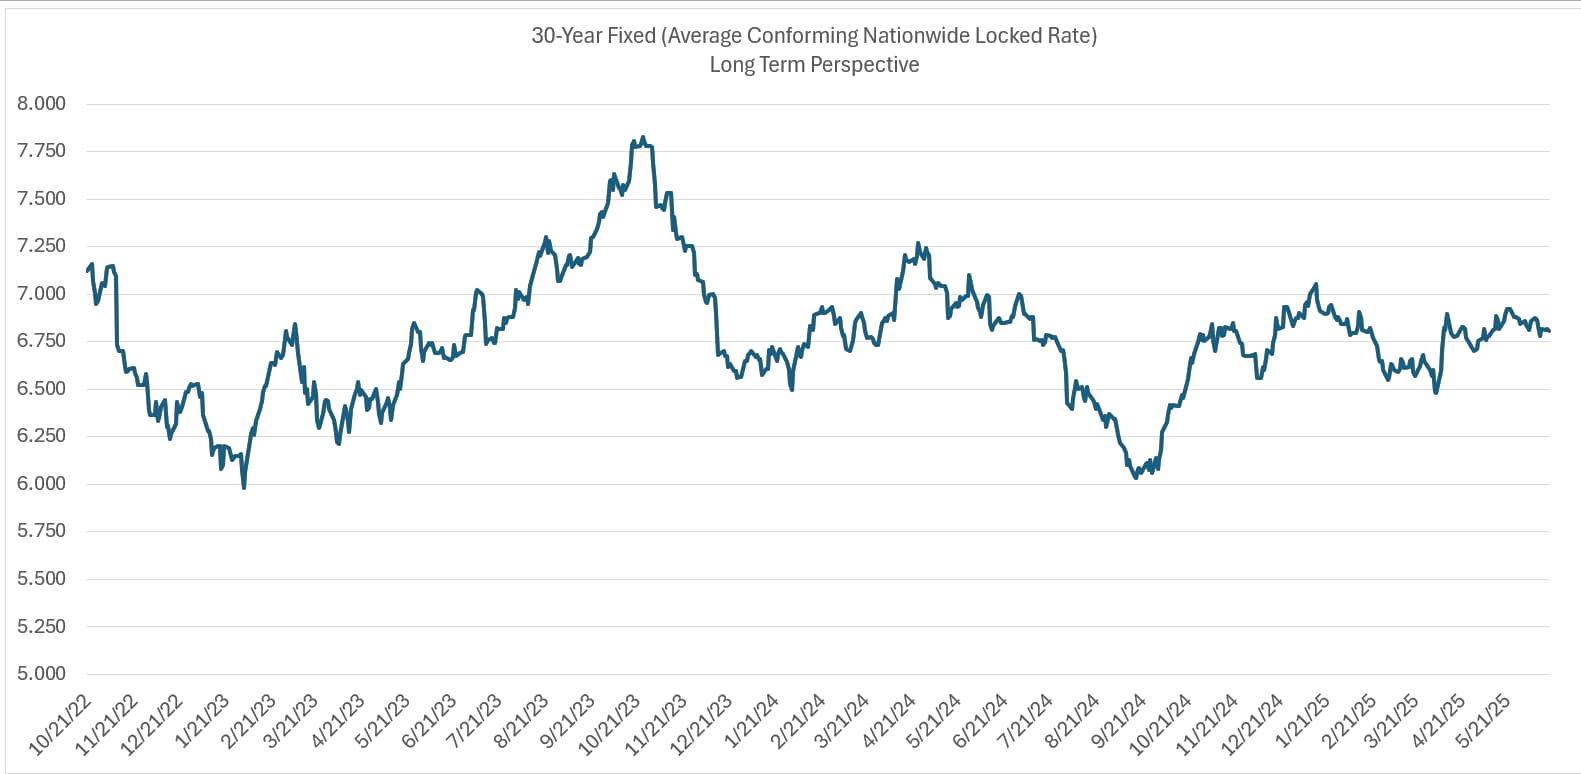
To put this week’s moves in context, let’s look at mortgage rate changes over the past 30, 90, and 180 days for 30-year fixed conventional loans:
-
Last 30 Days: -25 bps.
-
Last 90 Days: -50 bps.
-
Last 180 Days: -30 bps.
|
|
|
|
|
|
July FOMC Meeting Recap
At the July 29–30, 2025, FOMC meeting, the Federal Reserve kept the federal funds rate steady at 4.25%–4.50%, marking the fifth straight meeting without a change. This pause follows three rate cuts in 2024 (September, November, December), totaling 100 basis points. The Fed’s statement noted a “moderated” economy and “somewhat elevated” inflation, with labor markets still “solid” at a 4.1% unemployment rate. They’re sticking to their plan of reducing Treasury holdings ($5 billion/month) and mortgage-backed securities ($35 billion/month).
Dissension Drama: For the first time in nearly five years, two governors—Michelle Bowman and Christopher Waller—dissented, pushing for a 0.25% rate cut. This is rare; the FOMC typically moves in lockstep, with dissents occurring in less than 5% of meetings since 2000. Their push reflects growing concern about a cooling economy, with Q2 GDP growth at 1.0% and job growth slowing (142,000 in August vs. 202,000 expected).
What Does This Mean?
The dissension signals cracks in the Fed’s unity. Bowman and Waller, see risks in waiting too long to cut rates, especially with signs of economic slowdown (e.g., declining housing starts and consumer confidence). This could foreshadow a more dovish tilt at the September meeting, particularly if next week’s CPI or Retail Sales data softens. However, Chair Powell’s hawkish press conference—downplaying a September cut and emphasizing data dependency—suggests the majority still prioritizes inflation control over growth concerns.
Why No Change?
The Fed held steady due to:
-
Inflation Above Target: Core inflation at 3.0% is above the Fed’s 2% goal, fueled partly by tariff-related distortions.
-
Solid Labor Market: Unemployment at 4.1% and steady jobless claims show resilience, reducing urgency for cuts.
-
Tariff Uncertainty: Ongoing trade policy noise (e.g., Trump’s tariff plans) complicates the inflation outlook, making the Fed cautious.
The FOMC’s language shifted slightly, downgrading economic growth from “solid” to “moderated,” but didn’t signal imminent cuts, preserving “optionality” for September.
What’s Next?
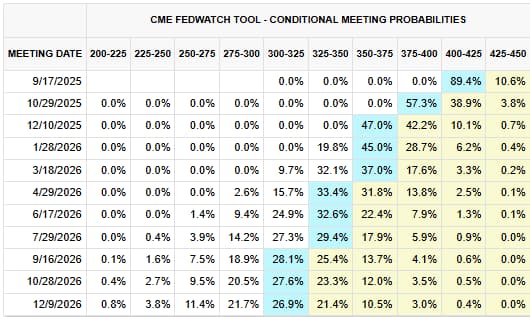
As of now the market is pricing in an 89.4% probability of a 25 basis point rate cut at the next meeting. This is the highest odds in many months and is welcome news to borrowers. Next week’s CPI and Retail Sales will be closely watched. A soft CPI could push cut probabilities higher, potentially lowering mortgage rates. Strong data might delay cuts, keeping rates steady or higher. Borrowers should watch for Fed speeches and any tariff news, as these could sway market bets. The dissension suggests the Fed’s not asleep at the wheel, but they’re not rushing either—stay tuned for a potential shift
|
|
|
Next FOMC Meeting: Wednesday, September 17
Current Fed Funds Rate Range: 4.25% – 4.50%
|
|
|
Fed Funds Probabilities Table
How to Interpret: The top row lists fed fund rate ranges. The left-most column lists upcoming dates for FOMC rate cut decisions. The values represent the probability of the fed funds rate lying in that range. Each row will sum to 100%. The probabilities are market-based and derived from the prices where futures contracts are trading.
|
 |
|
|
 |
|
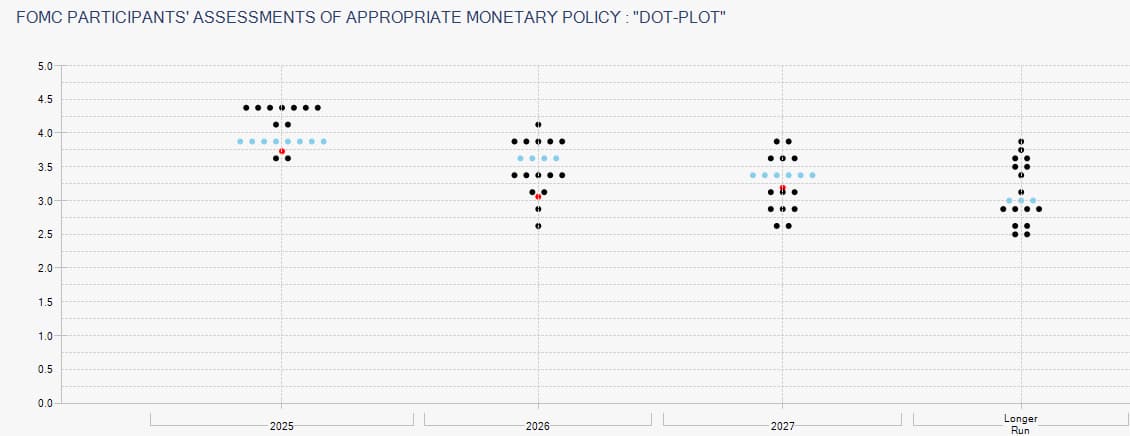
How to Read the Fed’s Dot Plot (chart below)
● Each dot represents one FOMC member’s forecast.
● There are 19 participants in the dot plot:
-
▪︎ 7 Fed Board Governors (nominated by the President and confirmed by the Senate
-
▪︎ 12 Regional Fed Bank Presidents
● The red dot shows the market’s forecast, based on the price where futures are trading.
● The blue dots represent the median forecast.
● The greater the dispersion in the dots, the less consensus between the participants.
Usefulness for Borrowers: Provides an educated indication of where the Fed Funds rate may be in future years.
|
|
|
|
|
|
|
|
Question: Why should I stay abreast of upcoming economic news?
Answer: Financial markets react to disparities between expected versus actual economic data. On days where highly anticipated economic data is released there is a greater likelihood of heightened volatility (risk). This is particularly relevant if you are locking in a rate.
|
|
|
|
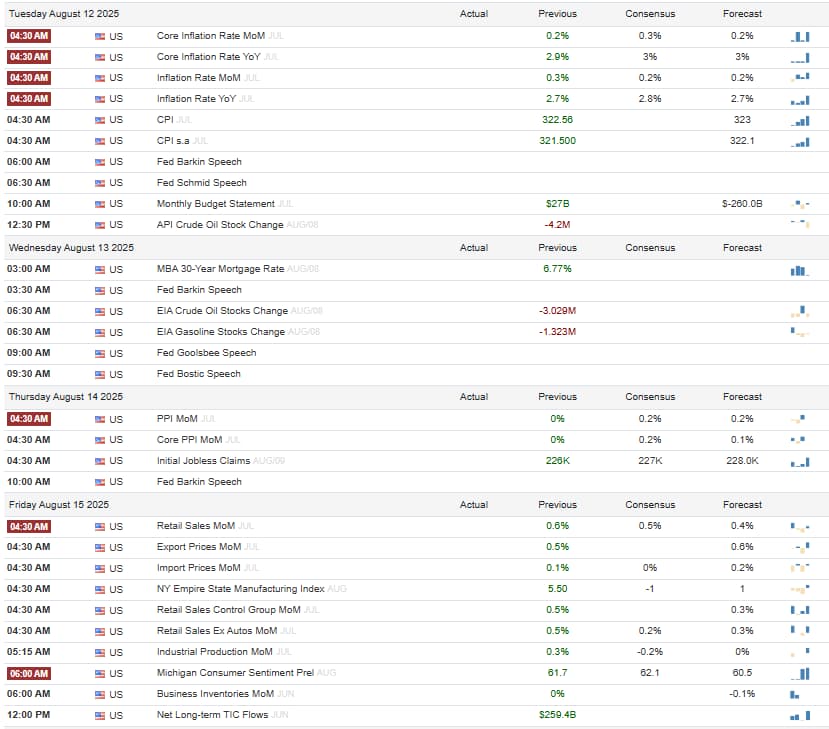
Here’s a rundown of this week’s key economic data being released — what’s coming & why it matters:
-
What: Consumer Price Index (CPI). The CPI measures the average change in prices paid by consumers for goods and services, like food, gas, and housing. It’s a key gauge of inflation, which the Federal Reserve closely monitors to guide monetary policy.
-
When: Tuesday, August 12, 2025, at 5:30 AM PST
-
Volatility Risk: 🔥🔥🔥🔥🔥 (Very High)
-
Market’s Expectation: Analysts expect a year-over-year CPI increase of about 3.0%, with core CPI (excluding food and energy) at 3.2%, based on recent trends.
-
What to Watch For: Look for surprises in core CPI, as it’s a better indicator of persistent inflation. A higher-than-expected reading could signal stubborn inflation, pushing bond yields and mortgage rates up. A lower reading might fuel expectations of Fed rate cuts, potentially lowering mortgage rates.
-
Significance for Mortgage Rates: CPI directly affects inflation expectations, which drive Treasury yields. Mortgage rates, tied to the 10-year Treasury note, often rise with higher inflation data, as lenders demand higher rates to offset reduced purchasing power. A hot CPI could spike rates, while a cooler report might ease them, offering borrowers a chance to lock in lower rates.
|
|
|
-
What: Producer Price Index (PPI). The PPI tracks changes in prices received by producers for goods and services, reflecting wholesale inflation. It’s a leading indicator of CPI, as producer costs often pass through to consumers.
-
When: Wednesday, August 13, 2025, at 5:30 AM PST
-
Volatility Risk: 🔥🔥🔥 (Moderate)
-
Market’s Expectation: Markets anticipate a 0.2% month-over-month increase, with core PPI up 0.3%, aligning with recent data.
-
What to Watch For: Focus on core PPI for signs of pipeline inflation. A jump could hint at rising consumer prices, while a drop might suggest easing inflationary pressure.
-
Significance for Mortgage Rates: PPI can signal future CPI trends, indirectly influencing Treasury yields. A higher-than-expected PPI might nudge mortgage rates up, as investors brace for tighter Fed policy. It’s less impactful than CPI but still worth watching.
|
|
|
-
What: Retail Sales. Retail Sales measure consumer spending at retail stores, online, and other outlets. It’s a key indicator of economic health, reflecting consumer confidence and spending power.
-
When: Friday, August 15, 2025, at 5:30 AM PST
-
Volatility Risk: 🔥🔥🔥🔥 (High)
-
Market’s Expectation: A 0.4% month-over-month increase is expected, slightly above last month’s 0.3%, driven by steady consumer demand.
-
What to Watch For: Watch for strength in discretionary spending (e.g., electronics, clothing). Strong sales could signal economic resilience, raising inflation concerns, while weak sales might suggest a slowdown, prompting rate cut bets.
-
Significance for Mortgage Rates: Strong retail sales can push Treasury yields higher, as they suggest robust growth and potential inflation, leading to higher mortgage rates. Weak data could lower yields and rates, as markets anticipate Fed easing to boost the economy.
|
|
|
-
What: Industrial Production and Capacity Utilization. This report measures output at factories, mines, and utilities, and the percentage of production capacity in use. It reflects manufacturing health and economic activity.
-
When: Friday, August 15, 2025, at 6:15 AM PST
-
Volatility Risk: 🔥🔥 (Low-Moderate)
-
Market’s Expectation: Production is expected to rise 0.3% month-over-month, with capacity utilization steady at 78.5%.
-
What to Watch For: Look for unexpected changes in capacity utilization, as high levels can signal overheating and inflation risks.
-
Significance for Mortgage Rates: This release has a milder impact but can influence yields if it signals economic strength or weakness. Strong data might slightly increase rates, while weak data could keep them stable or lower.
|
|
|
|
|
|
|
Housing Corner
|
|
California’s housing market is tapping the brakes in mid-2025, with sales slowing, homes remaining on the market longer, inventory rising, and prices leveling out and even dipping in some regions. Compared to the national market, the Golden State’s high costs amplify these challenges, making affordability a persistent hurdle. Below, we break down the latest trends in home sales, prices, and inventory, unpack what’s driving this cooldown, and offer tips for navigating this shifting landscape. Whether you’re eyeing a dream home or weighing your options, here’s what you need to know to stay ahead of the curve.
Home Sales Trends
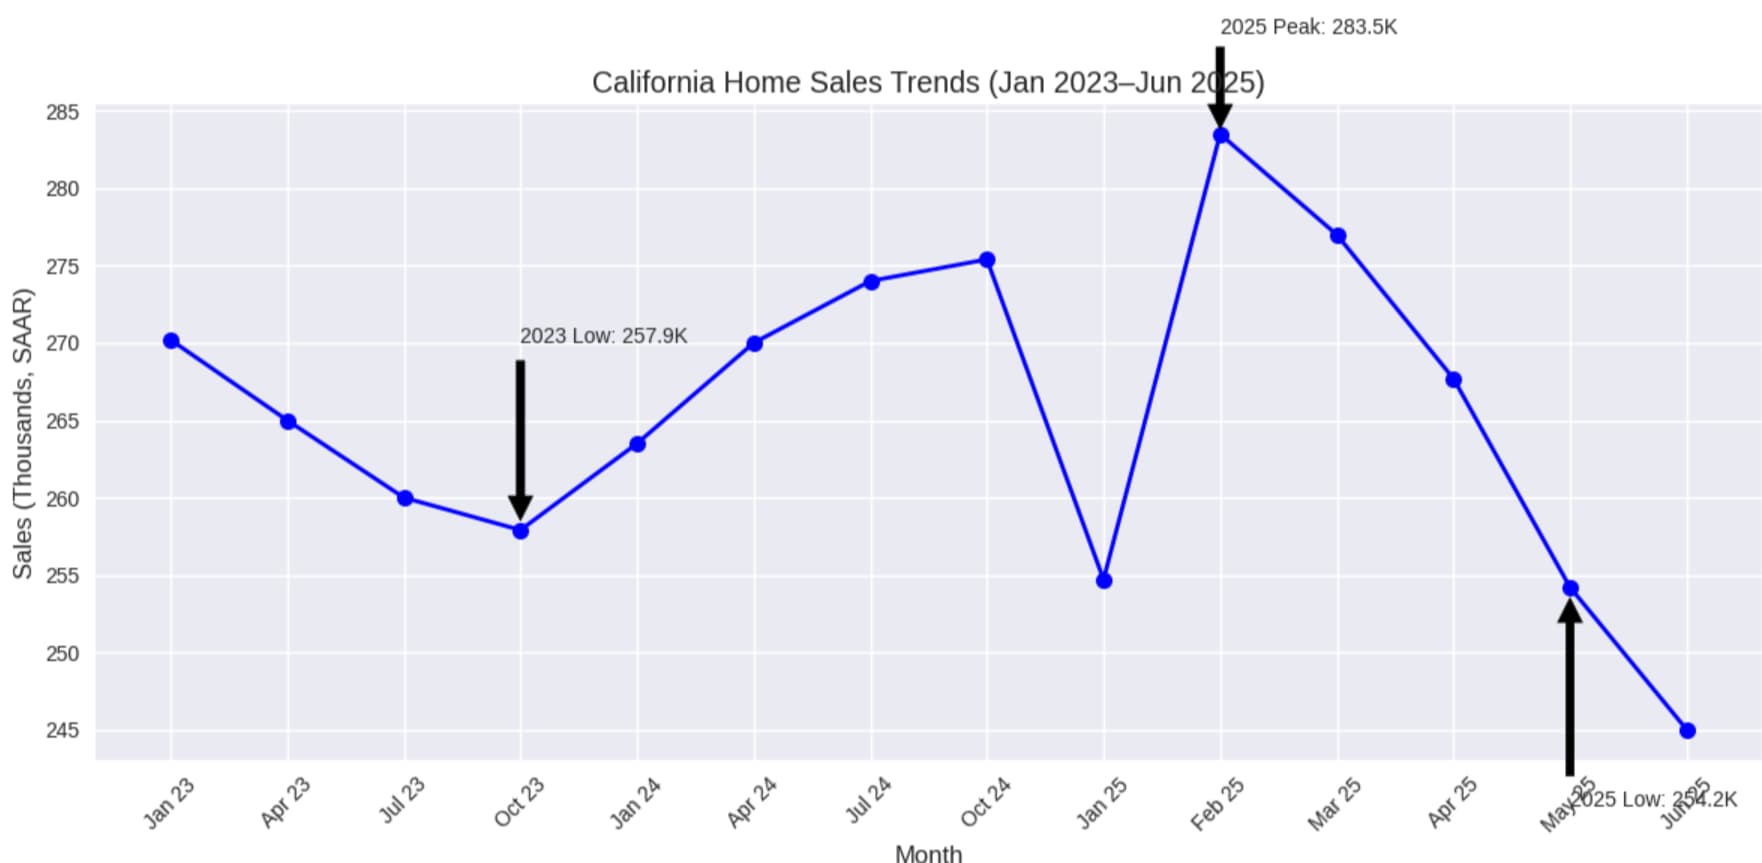
California’s home sales is are sputtering, a stark contrast to earlier optimism. In May 2025, existing single-family home sales dropped to 254,190 units (seasonally adjusted annualized rate), down 5.1% from April’s 267,710 and 4.0% from May 2024’s 264,850, marking the lowest level in four months. Year-to-date sales through May are barely up 0.3% compared to 2024, a far cry from the 10.5% annual increase (to 304,400 units) projected by the California Association of Realtors (C.A.R.) for 2025. This slowdown follows a brief Q1 surge (283,540 units in February, up 11.6% from January), but momentum faded as economic concerns grew.
Nationally, home sales are also cooling, with a 0.7% year-over-year decline in May 2025, per the National Association of Realtors (NAR). California’s steeper 4.0% drop reflects its heightened sensitivity to affordability pressures, though Southern California shows pockets of resilience compared to the Bay Area’s 8.2% sales decline. The lock-in effect—homeowners with sub-3% interest rates reluctant to sell—continues to dampen activity, but rising inventory is starting to draw cautious buyers back, especially in affordable regions like the Central Valley.
For homebuyers, this slowdown means less competition, but don’t expect a fire sale. Well-priced homes in high-demand areas are still moving, so work with a local agent to spot deals before the market shifts again.
|
 |
|
Home Price Trends
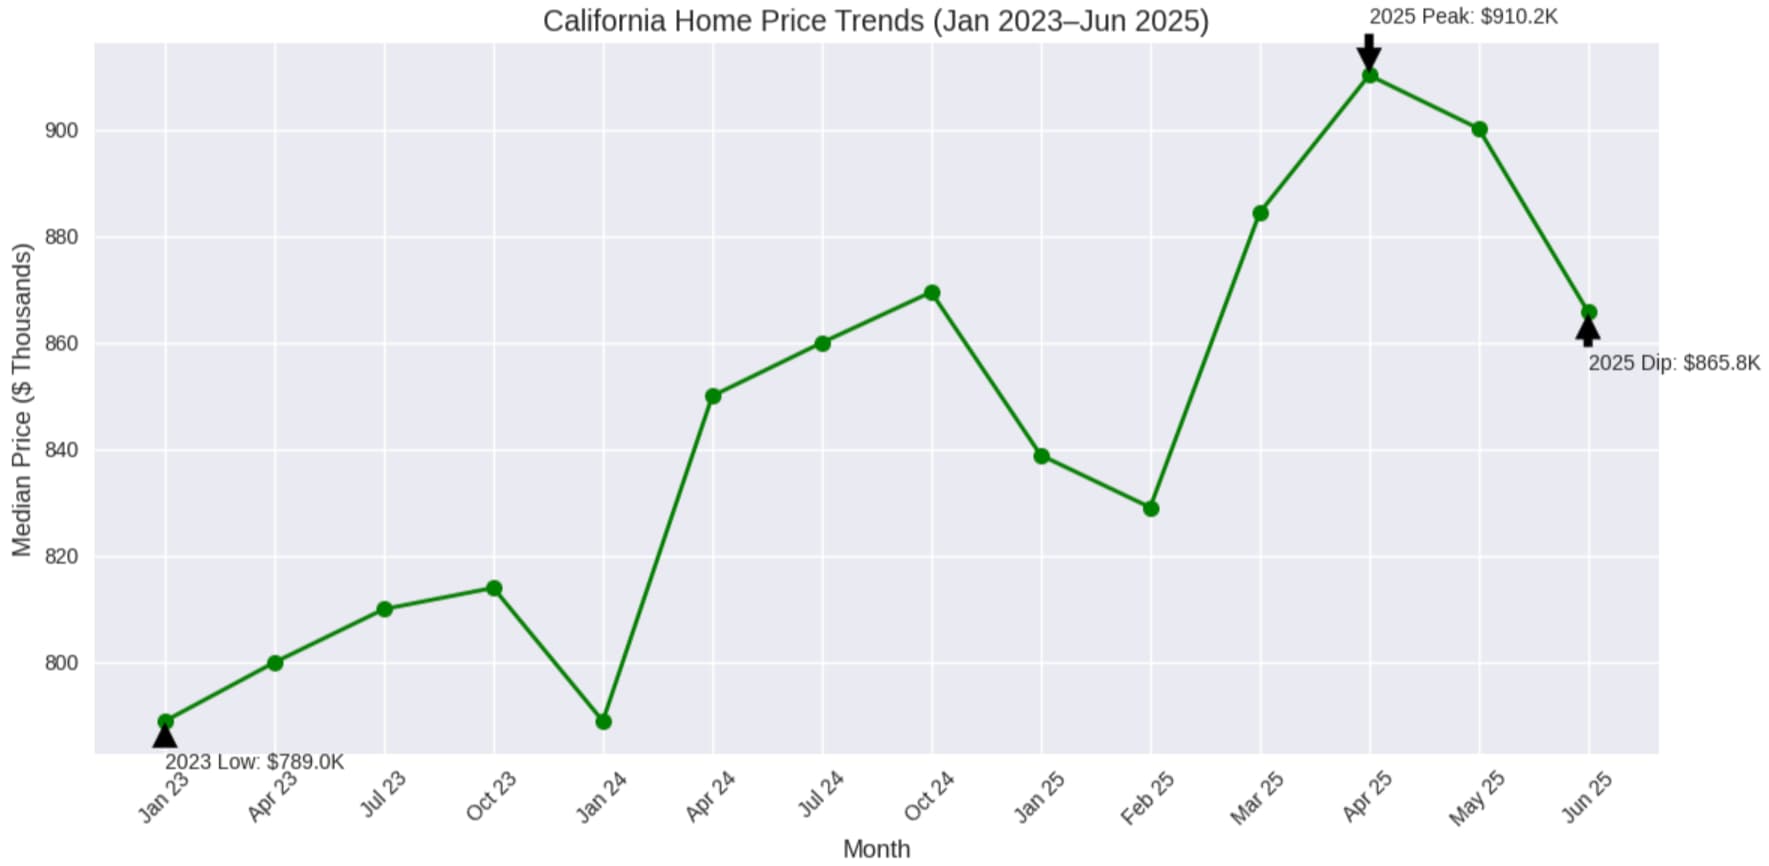
Home prices in California are softening, offering a glimmer of relief for buyers. The statewide median price in May 2025 fell to $900,170, down 1.1% from April and down 0.9% on a year-over-year basis. This marks a shift from earlier gains (e.g., March’s $884,350, up 3.5% year-over-year). Regional variations are notable: San Francisco’s median list price per square foot dropped 7.3% year-over-year, San Diego fell 2%, and Sacramento dipped 1.3%. However, the Central Coast ($1.125 million, up 6.2%) and Los Angeles ($855,000, up 1.8%) still see gains, reflecting localized demand. C.A.R.’s full-year forecast predicts a 4.6% rise to $909,400, but recent data suggests slower growth or declines in some markets.
Nationally, the median price rose 1.3% to $422,800 in May 2025, making California’s $900,170 median price a whopping 2.1 times higher than the national average and its 0.9% decline more pronounced than the U.S.’s modest gain. Prices remain near 2022’s peak of $900,000, but the slight dip reflects buyers pushing back against high costs and sellers adjusting expectations. For example, 15% of listings in May saw price cuts, up from 10% in 2024, signaling seller concessions.
|
 |
|
Inventory Buildup
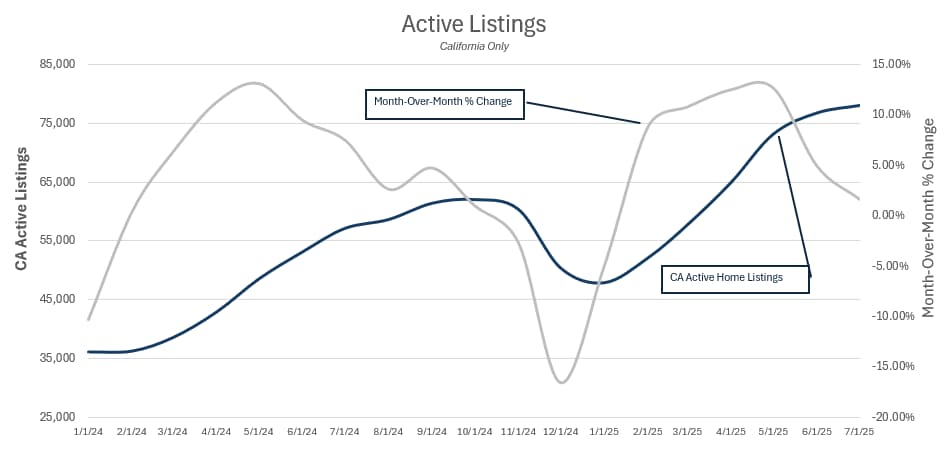
Inventory is surging, giving buyers more room to breathe. The Unsold Inventory Index (UII) hit 3.8 months in May 2025, up from 3.5 months in April and 2.6 months in May 2024. Active listings soared nearly 50% year-over-year in May, reaching 76,737 in June, the second-highest June level in a decade. February saw a 44% listing spike, and April hit 64,963 active listings, a 66-month high. Nationally, inventory reached 4.0 months in May, growing 28% year-over-year, but California’s 50% jump is much more dramatic, driven by faster listing growth.
Sellers are listing more as the dream of sub-3% rates fades, with January 2025 seeing the fastest year-over-year new listing growth in four years. New construction is slowing (housing starts down 12.5% from May to June), but foreclosures, up 7% in H1 2025, add to supply, especially in the Inland Empire.
This inventory boom means more choices and bargaining power, particularly in oversupplied areas like the Central Valley.
|
 |
Average Days on the Market
Homes are remaining listed for sale longer, a sign the market’s losing some pep-in-its-step. In June 2025, the median days on market (DOM) for California homes was 48 days, up from 31 days in December 2024 and up from 26 days in June 2024. May 2025 saw a median of 21 days, up from 16 days a year earlier. Regionally, Los Angeles hit 47 days and San Francisco reached 42 days in June, both the highest for June since 2016, compared to 30 days in Los Angeles in 2022. Southern California markets like Orange County average 35 days, still competitive but slower than the 15–20 days of 2021’s frenzy.
Nationally, the median DOM was 38 days in May 2025, making California’s 48 days in June notably higher, reflecting its pricier homes and buyer caution. Longer DOM signals less urgency, with 35.2% of homes in June seeing price drops (up from 23% in June 2024). This gives buyers time to shop and negotiate, especially in cooling areas like the Bay Area.
Why the Changes in the Housing Market?
-
Affordability Constraints: California’s median price ($900,170 in May) is 2.1 times the national average ($422,800), with only 16% of households able to afford it; flat from 2024.
-
Economic Uncertainty: Projected job growth of 1.1% and unemployment at 5.6% in 2025 (up from 5.4%) make buyers wary, while tariff fears and a slowing economy (Q2 GDP at 1.0%) add hesitation.
-
Supply Dynamics: Rising listings reflect sellers adjusting to higher rates and slowing construction (housing starts down 12.5% from May to June). Foreclosures, up 7% in H1 2025, boost supply, particularly in distressed areas like the Inland Empire.
-
Migration: California’s 2024 population growth (232,000) fuels some demand, but migration out of California to more affordable states reduces demands. Wildfires, like the Palisades fire, deter buyers in areas like the Central Coast, increasing inventory.
What’s the Prognosis?
The market is shaping up to be soft through late 2025, with sales likely flat or down from 2024’s 275,400 units; despite the California Association of Realtors’ 10.5% growth forecast. Prices may dip further in markets like San Francisco (down 7.3% year-over-year) or stabilize in high-demand areas like the Central Coast. Inventory could hit 4.5 months by Q4, but stay below the balanced 5–6 months. Nationally, sales (4 million) and price growth (2%) are sluggish, suggesting California’s trends are part of a broader cooling.
Homebuyer Takeaway: This cooling market is an opportunity many have been waiting for. With homes sitting longer and prices dipping in some regions, there is flexibility to negotiate harder—sellers are amicable to deeper concessions. In competitive markets like Los Angeles, get pre-approved to pounce on deals. Work with a local agent to navigate this shifting landscape and snag your dream home!
|
|
|
|
|
|
|