Mortgage Matters With Integrity
|
|
|
|
Written & Prepared by: Brian Tilton
|
|
|
|
|
|
|
|
Choosing the Optimal Rate:
Navigating the Discount Point vs. Lender Credit Tradeoff
|
|
|
|
When you’re locking in an interest rate on a mortgage, you’re generally presented with a range of rates from which you can select. Your options are:
- Pay discount points (upfront cost to lower the interest rate to a below-market rate)
- Accept a lender credit (money given to you to apply towards closing costs in exchange for an above-market rate)
- Go with the “par” rate (neither an upfront cost, nor lender credit. This corresponds with the prevailing current market rate.)
Option 1: Paying Discount Points – Buy Down the Rate
Paying discount points means you’re essentially pre-paying interest to get a lower rate. Each “1 point” costs 1% of the loan amount. The relationship between the rate buydown and points is not linear and fluctuates by day and by rate. In other words, a 1 point discount could lower the rate anywhere from 0.25% to 0.75%, depending on a multitude of factors.
Hypothetical Example:
- $500,000 loan amount
- 1 point = $5,000
- Reduces your rate by 0.375% from 5.75% to 5.375%
This rate reduction lowers your monthly payment by about $118/month. So how long would it take to break even?
Breakeven formula:
Cost of points ÷ Monthly savings = Breakeven in months
$5,000 ÷ $118 ≈ 42.4 months (3.5 years)
If you keep the loan longer than 3.5 years, the rate buydown starts to save you money. But if you refinance or sell the home before then, it’s a losing proposition.
Option 2: Opting for a Lender Credit – Reduce Costs Now
This is the flip side of the same coin. You accept a slightly higher rate and the lender gives you a credit toward closing costs—helpful if you want to preserve cash or want a zero-cost loan.
Hypothetical Example:
- Instead of 5.75%, you take 6.00%
- Lender gives you $4,000 toward closing
- Monthly payment increases about $80
Breakeven formula:
Lender Credit ÷ Monthly Payment Increase = Breakeven in months
$4,000 ÷ $80 ≈ 50.0 months (4.1 years)
In this example, if you anticipate refinancing or selling the home in under 4.1 years it makes financial sense to opt for a lender credit. You’re not putting cash into a loan you’ll soon replace.
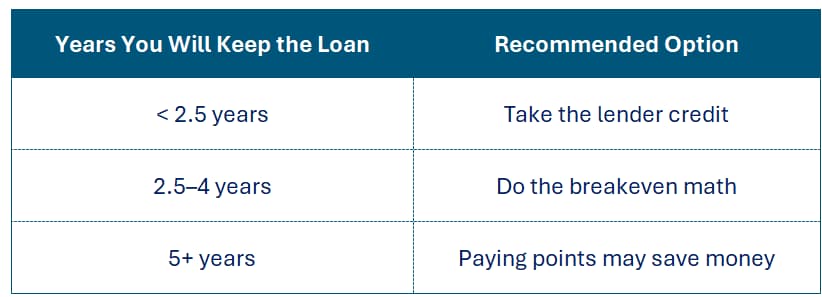
The Key Factor: How Long Will You Keep the Loan?
A generalized guide of which approach is financial more advantageous is as follows:
|
 |
|
|
|
Unfortunately, knowing how long you will have the loan isn’t generally know with certainty.
1) A myriad of life events could impact selling a home:
● Marriage / Divorce
● Job Changes
● Following kids or grandkids to a different state
● Upgrade to a larger home due to a growing family
2) Where interest rates trend in future years, will impact whether it makes sense to refinance. A reduction in interest rates could lead to refinancing. But predicting where rates will be in future years is a challenging task due rates being dependent on a multitude of continuously changing factors:
● Future inflation rates
● Global economic growth
● Monetary policy
● Fiscal policy
● Consumer behavior
Nevertheless, most economists are forecasting a reduction in rates during the next 12-24 months.
🔮 Bottom line: You’re not just betting on your time in the home—you’re also betting on where interest rates will be in the future.
It’s Not Only the Objective Math: Subjective Considerations Matter Too
While this article has focused on whether it is financially advantageous for borrowers to opt for discount points or a lender credit, based on the breakeven math, it’s important to note that subjective non-financial factors often influence decisions:
- Cash flow priorities: Do you need to conserve cash for renovations, furniture, or emergency funds?
- Job mobility: Might you relocate for work soon?
- Emotional comfort: Some borrowers value a lower monthly payment for peace of mind, regardless of breakeven
- Tax implications: Points may be deductible (consult a tax advisor)
So even if the math says one thing, your personal situation and goals might dictate another.
Final Takeaway
There’s no one-size-fits-all answer. Paying points might save you thousands—or cost you money if you move or refinance too soon. Lender credits can preserve cash but cost more over time.
If you’re not sure how long you’ll keep the loan or if you think you’ll refinance in a year or two, the safer move is generally to minimize upfront costs and take the lender credit.
👉 Want a Custom Analysis?
If you’d like to see how the numbers play out with your actual scenario, feel free to contact us. Regardless of whether we’ve worked with you in the past, it would be our pleasure to run the numbers so you can make an informed decision— no pressure, just clarity.
|
|
|
|
|
|
|
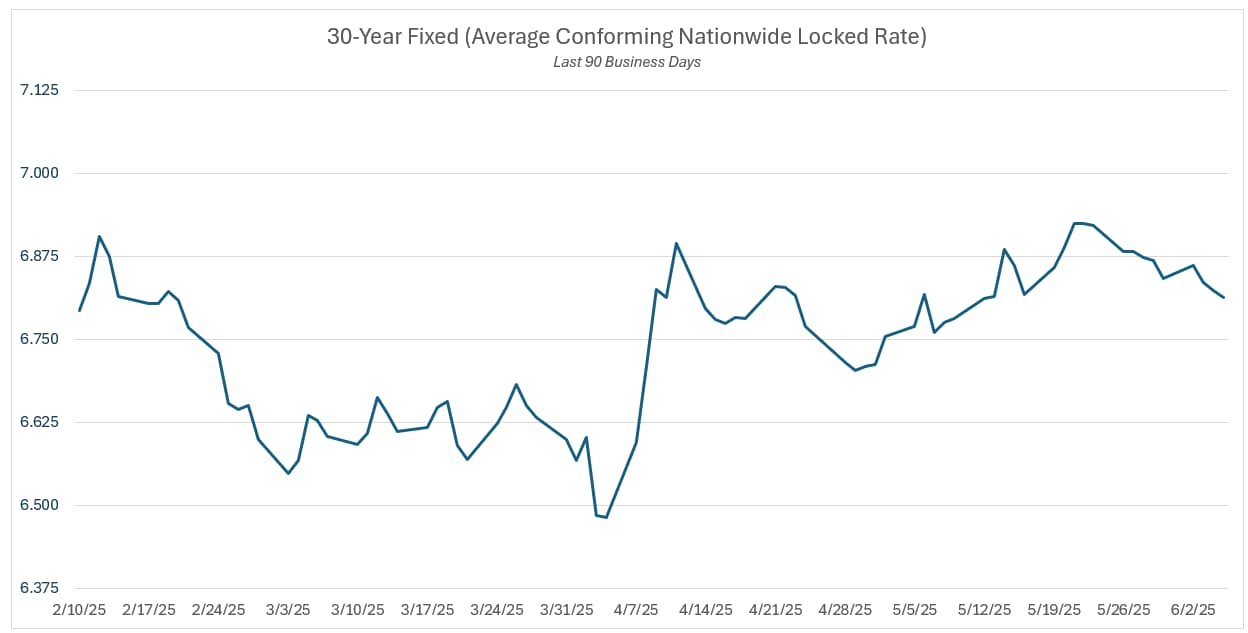
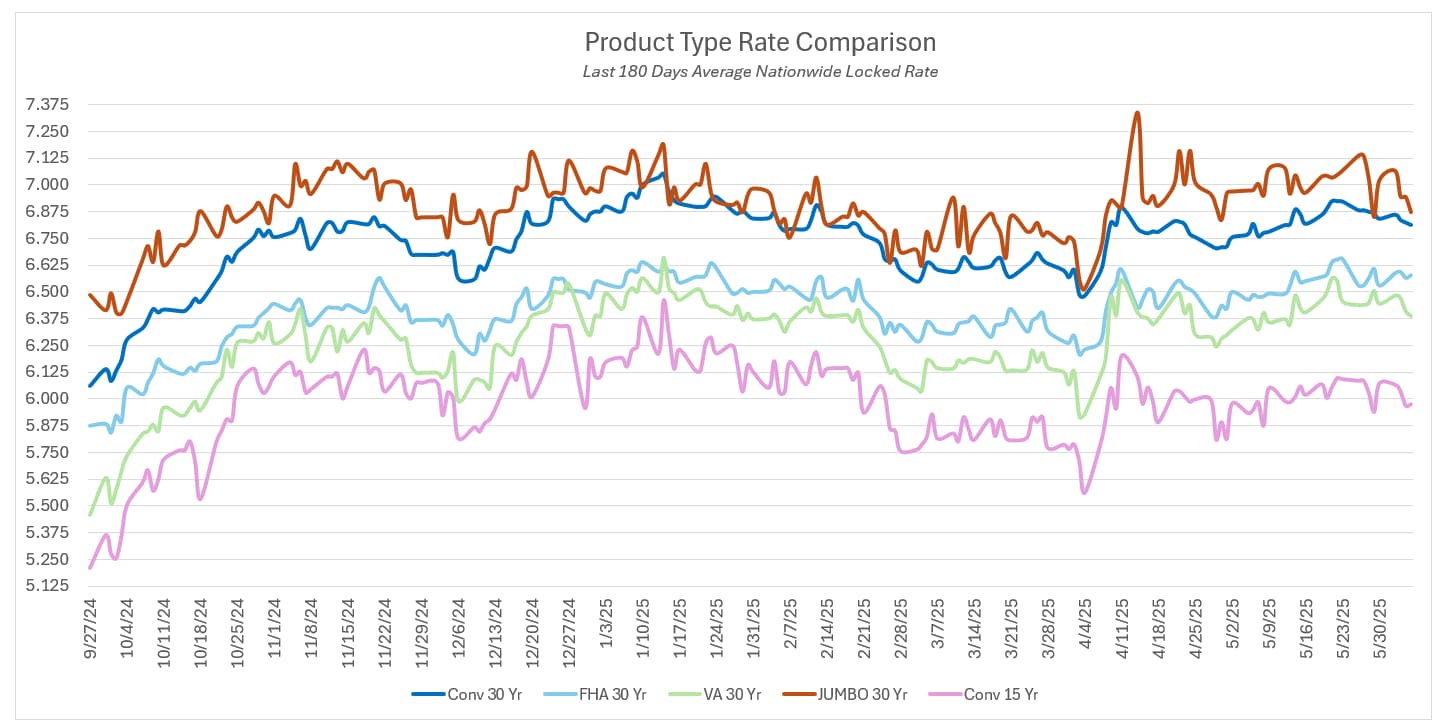
This past week, mortgage rates experienced a dynamic ride, with a significant improvement early in the week followed by jarring deterioration later in the week. Let’s dive into the past week’s activity, analyze the changes across mortgage products, compare their performance to Treasuries, and explore what borrowers should focus on next week.
Here’s a breakdown of the rate changes across various mortgage products for the week of June 1–June 6:
-
30-Year Fixed Conventional: -0.04%
-
15-Year Fixed Conventional: -0.03%
-
30-Year Fixed FHA: -0.02%
-
30-Year Fixed VA/USDA: -0.02%
-
5/6 ARM: -0.05%
-
7/6 ARM: -0.04%
What Caused the Improvement in the Early Week
-
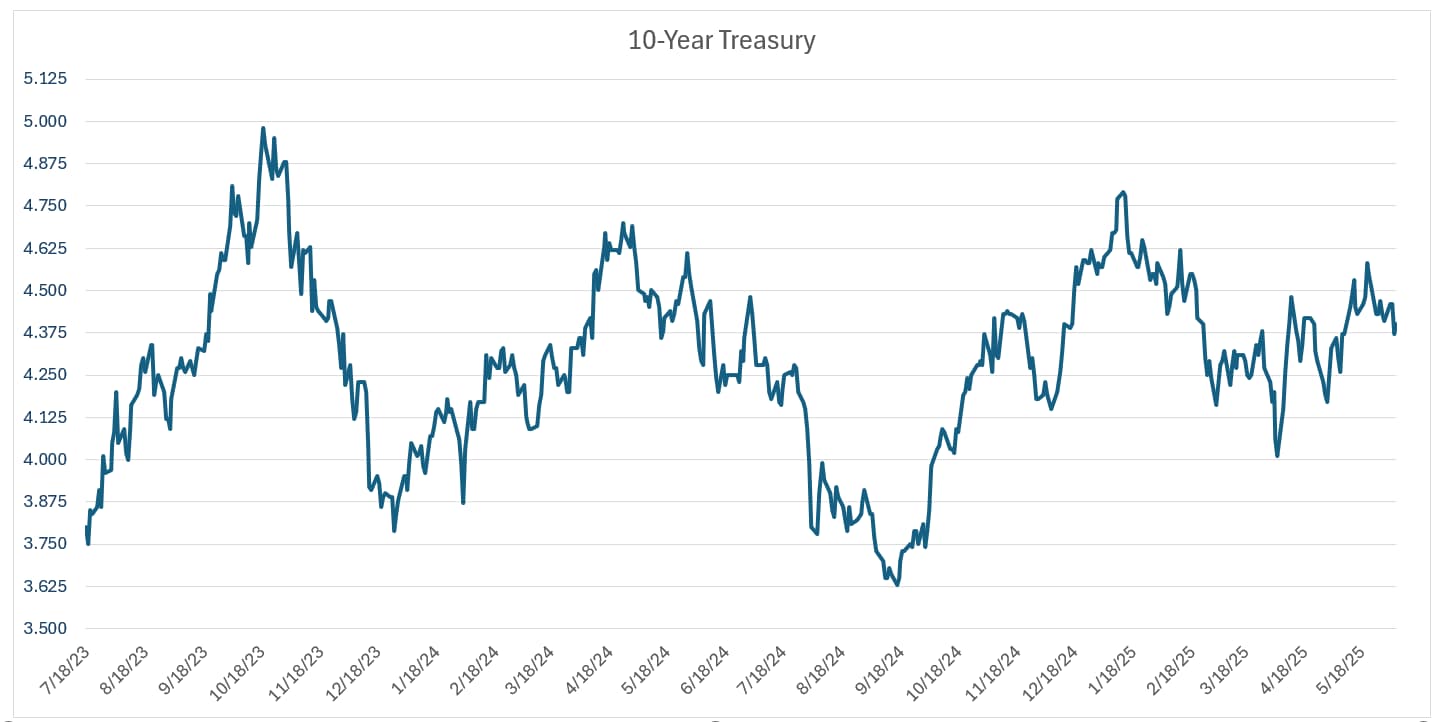
Investor Caution preceeding the CPI and jobs data. This caused a “flight to safety” whereby investors pulled funds out of riskier assets such as stocks, and allocated into safe haven Treasuries. Since mortgages tend to follow the 10-year Treasury they indirectly benefited.
-
Trade/Tariff jitter and growing concern about fiscal deficits contributed to the “flight to safety”. FHA/Government Loans: Rates remained relatively stable, benefiting from consistent demand and government support.
What Caused the Worsening Later in the Week
-
Improved investor sentiment following the stronger than expected jobs data led to a “risk-on” reversal whereby assets shifted back into equities. Moreover, the strong jobs data raises future inflationary concerns, thereby lowering the probabilities of a Fed rate cut.
-
Speculation emerged that there is hope for trade talks and a scale-back in tariffs.
|
|
|
|
|
|
|
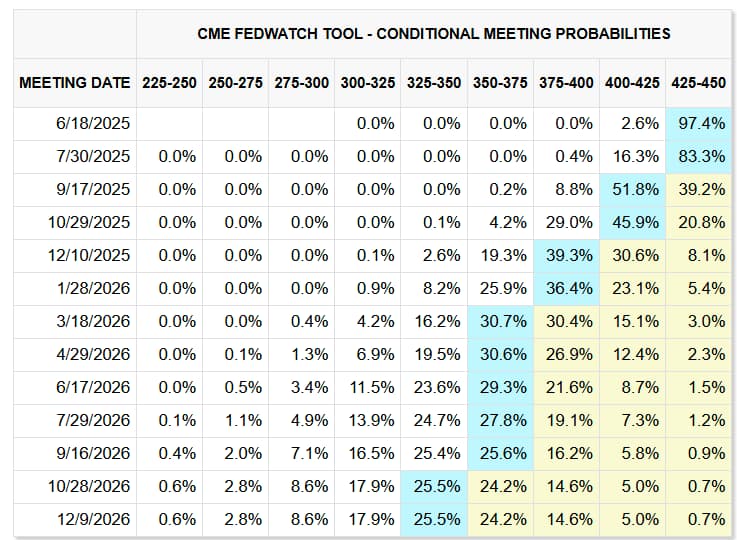
As of today, financial markets are pricing in a mere 2.6% probability of a 25 basis point cut in the Fed Funds rate at the next Fed meeting; therefore a 97.4% probability of no change. For comparison, the prior newsletter has an estimate of 8.3%. Looking further out to the July 30th FOMC meeting, the market is pricing in a 16.3 probability of a 25 basis point cut, and a 0.4% probability of a 50 basis point cut.
Key factors fueling this shift in probabilities include:
-
Persistent Inflation: Recent FOMC minutes from the May 6-7, 2025, meeting highlighted the Fed’s growing concerns about inflation remaining elevated, particularly due to tariffs. Fed officials noted that these tariffs could lead to one-time price increases, potentially pushing inflation higher in the second half of 2025. Atlanta Fed President Raphael Bostic emphasized the uncertainty surrounding trade policy, stating that it complicates economic forecasting, while Fed Governor Christopher Waller suggested tariffs might temporarily elevate prices but not necessarily derail long-term rate cut plans.
-
Double-Click (Deeper Dive): Tariffs increase the cost of imported goods, which can drive up consumer prices and contribute to inflationary pressures. The Fed, tasked with maintaining price stability, is less likely to cut rates when inflation risks are elevated, as lower rates could further stimulate demand and exacerbate price increases. This uncertainty has led markets to lower expectations for an imminent rate cut, favoring a steady policy stance at the June meeting.
-
Solid Economic Growth & Labor Market Strength: Economic data from April and May 2025 indicates continued resilience in the U.S. economy. The Bureau of Labor Statistics reported solid job growth in April, and economist Oren Klachkin estimated 130,000 jobs added in May, exceeding consensus forecasts. Despite some softening indicators, such as a slowdown in hiring, companies have not resorted to widespread layoffs, signaling labor market stability.
-
Double-Click (Deeper Dive): A strong economy and labor market reduce the urgency for rate cuts, as the Fed aims to balance growth with inflation control. Robust job growth and GDP expansion suggest the economy can sustain current rates (4.25%-4.50%) without immediate risk of recession. This stability diminishes the need for monetary easing, prompting markets to assign a lower probability to a June rate cut.
Why does this matter to borrowers?
The federal funds rate is like the thermostat for borrowing costs. When the Fed raises it, banks pay more to borrow, and they pass those costs to you via higher mortgage rates. But if the Fed cuts rates, mortgage rates could ease, making homebuying more affordable.
|
|
|
Next FOMC Meeting: Wednesday, June 18
Current Fed Funds Rate Range: 4.25% – 4.50%
|
 |
|
|
 |
|
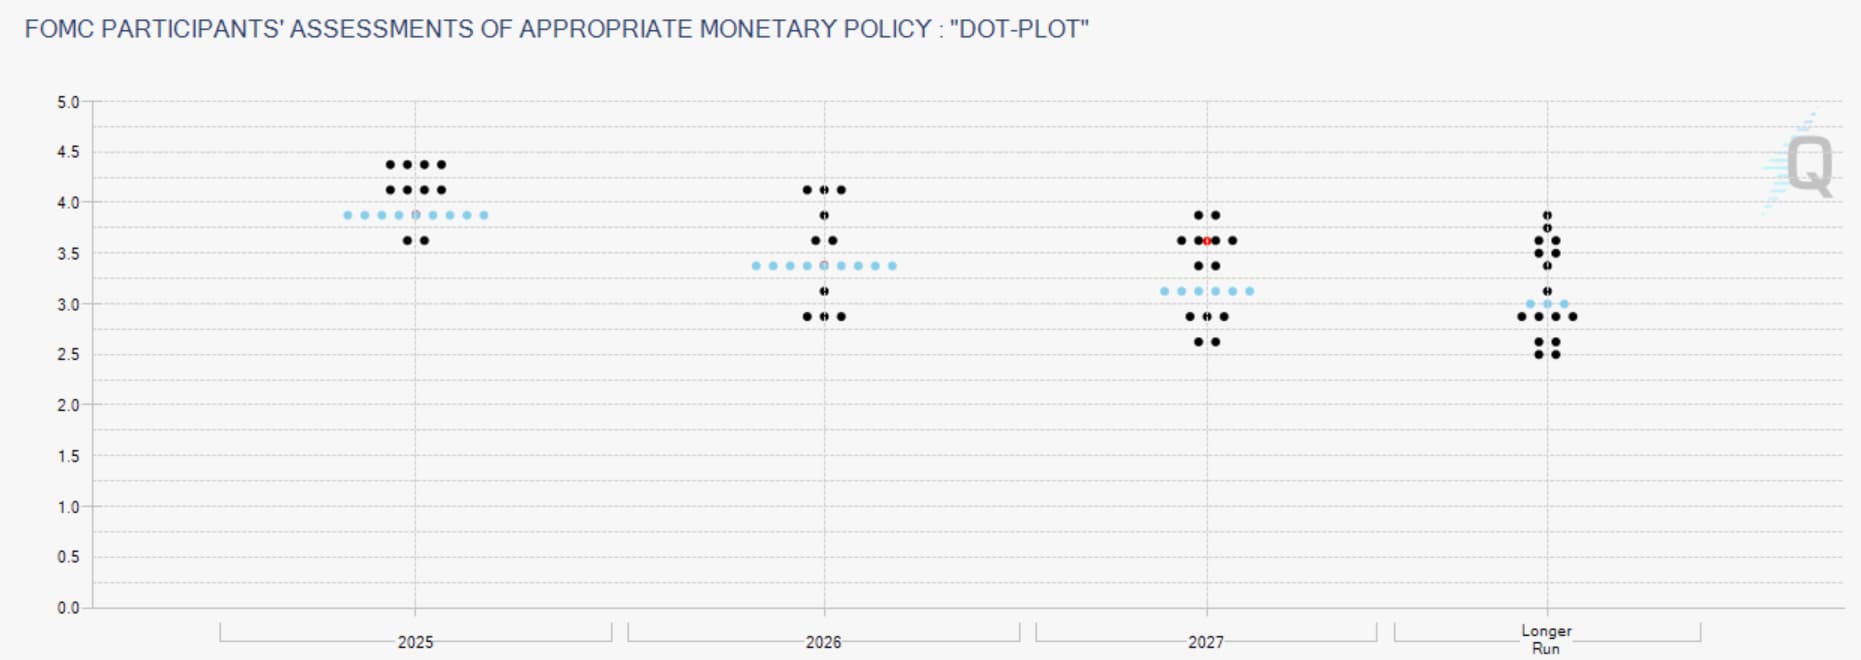
How to Read the Fed’s Dot Plot (chart below)
● Each dot represents one FOMC member’s forecast.
● There are 19 participants in the dot plot:
-
▪︎ 7 Fed Board Governors (nominated by the President and confirmed by the Senate
-
▪︎ 12 Regional Fed Bank Presidents
● The red dot shows the market’s forecast, based on the price where futures are trading.
● The blue dots represent the median forecast.
● The greater the dispersion in the dots, the less consensus between the participants.
Usefulness for Borrowers: Provides an educated indication of where the Fed Funds rate may be in future years.
|
|
|
|
|
|
|
|
Question: Why should I stay abreast of upcoming economic news?
Answer: Financial markets react to disparities between expected versus actual economic data. On days where highly anticipated economic data is released there is a greater likelihood of heightened volatility (risk). This is particularly relevant if you are locking it a rate.
|
|
|
|
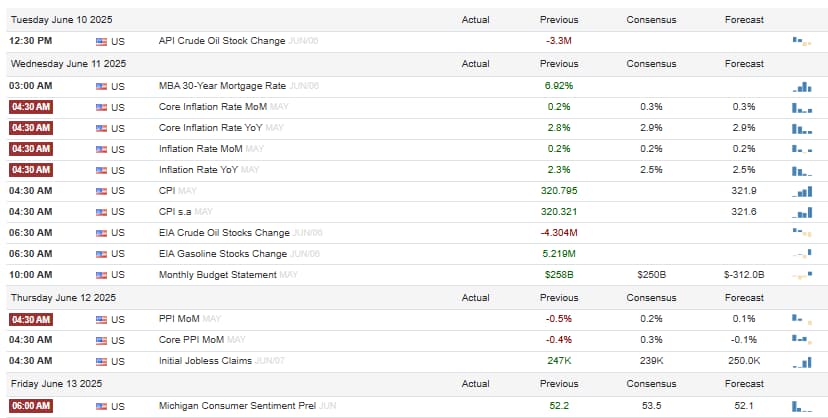
Here’s a rundown of this week’s key economic data being released — what’s coming & why it matters:
-
What: Consumer Price Index (CPI). The CPI measures the average change in prices paid by consumers for goods and services, such as food, energy, and housing. It’s a key indicator of inflation, which influences Federal Reserve policy and bond yields.
-
When: Wednesday, June 11, 2025, at 5:30 AM PST
-
Volatility Risk: 🔥🔥🔥 (High)
-
Market’s Expectation: Analysts expect a year-over-year CPI increase of 3.1%, slightly down from last month’s 3.2%. Core CPI (excluding food and energy) is projected to remain steady at 3.6%.
-
What to Watch For: Look for whether the actual CPI data aligns with expectations. A higher-than-expected reading could signal persistent inflation, prompting investors to demand higher yields on bonds, pushing mortgage rates up. A lower reading might ease rate pressures, suggesting inflation is cooling.
-
Mortgage Rate Significance: Mortgage rates are closely tied to the 10-year Treasury yield, which reacts to inflation expectations. If CPI exceeds forecasts, expect upward pressure on rates as investors anticipate tighter Fed policy. Borrowers should monitor this release, as it could affect rate lock-in decisions.
|
|
|
-
What: Producer Price Index (PPI). The PPI tracks changes in prices received by producers for goods and services, offering an early signal of inflationary pressures before they reach consumers. It’s a leading indicator for CPI.
-
When: Thursday, June 12, 2025, at 5:30 AM PST
-
Volatility Risk: 🔥🔥 (Moderate)
-
Market’s Expectation: A 0.2% month-over-month increase is anticipated, with year-over-year PPI at 2.8%.
-
What to Watch For: Focus on whether PPI suggests rising costs for producers, which could foreshadow higher consumer prices. A surprise increase might spook bond markets, raising yields and mortgage rates.
-
Mortgage Rate Significance: While less impactful than CPI, a high PPI reading can reinforce inflation fears, nudging mortgage rates higher. Borrowers should watch for unexpected spikes, as they may signal rate volatility.
|
|
|
-
What: Retail Sales. This measure consumer spending on goods and services, reflecting economic activity and consumer confidence. Strong retail sales indicate a robust economy, while weak sales may signal a slowdown.
-
When: Tuesday, June 17, 2025, at 5:30 AM PST
-
Volatility Risk: 🔥🔥🔥 (High)
-
Market’s Expectation: A 0.3% month-over-month increase is expected, compared to last month’s 0.4% growth.
-
What to Watch For: A stronger-than-expected report could fuel concerns about economic overheating, potentially increasing bond yields and mortgage rates. Conversely, weaker sales might ease rate pressures but raise recession fears.
-
Mortgage Rate Significance: Strong consumer spending can drive inflation expectations, pushing up Treasury yields and mortgage rates. Borrowers planning to lock in rates should be cautious if retail sales exceed forecasts, as rates may climb.
|
|
|
-
What: Housing Starts. This statistic tracks the number of new residential construction projects begun in a given period. It’s a gauge of the housing market’s strength and economic momentum.
-
When: Wednesday, June 18, 2025, at 5:30 AM PST
-
Volatility Risk: 🔥 (Low)
-
Market’s Expectation: Expected to show 1.35 million annualized units, slightly up from last month’s 1.33 million.
-
What to Watch For: Strong housing starts suggest builder confidence and demand, which could support higher rates. Weak data might indicate housing market softness, potentially stabilizing rates.
-
Mortgage Rate Significance: While not a major driver, robust housing starts can indirectly support higher rates by signaling economic strength. Borrowers should note this as a secondary indicator influencing market sentiment.
|
|
|
|
|
Housing Corner
|
|
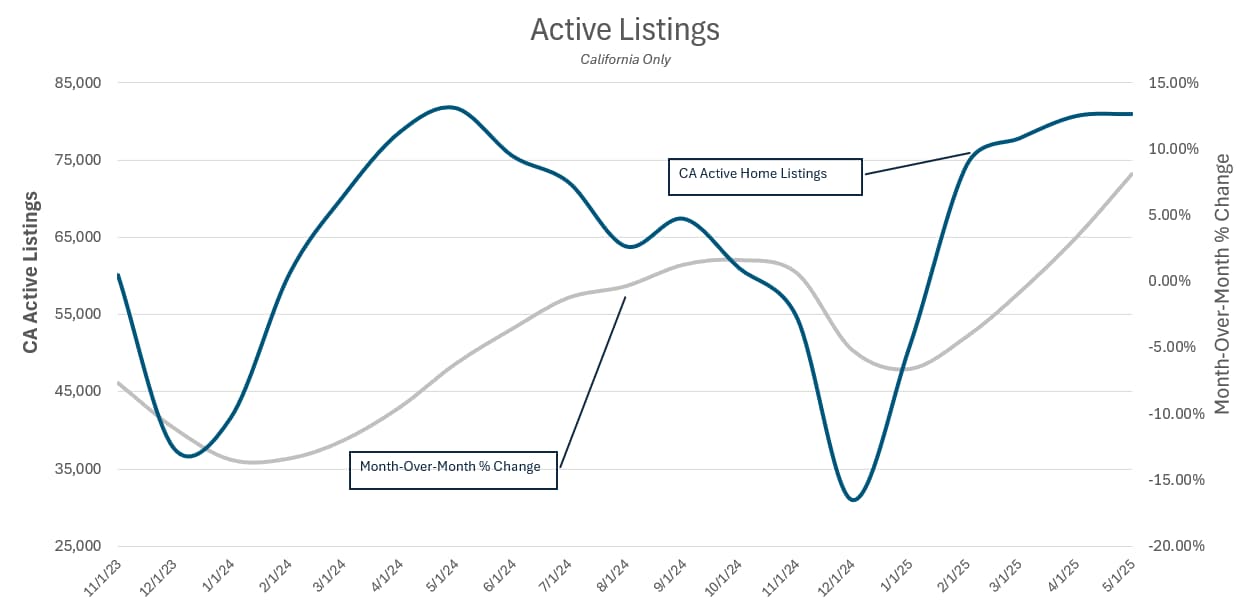
In May 2025, California’s active listings rose 12% on a month-over-month basis, and 50% year-over-year. This marks the 16th consecutive month that inventory has risen on a year-over-year basis. Moreover, California’s homes listed for sale is at its highest level since October 2019.
|
|
|
 |
|
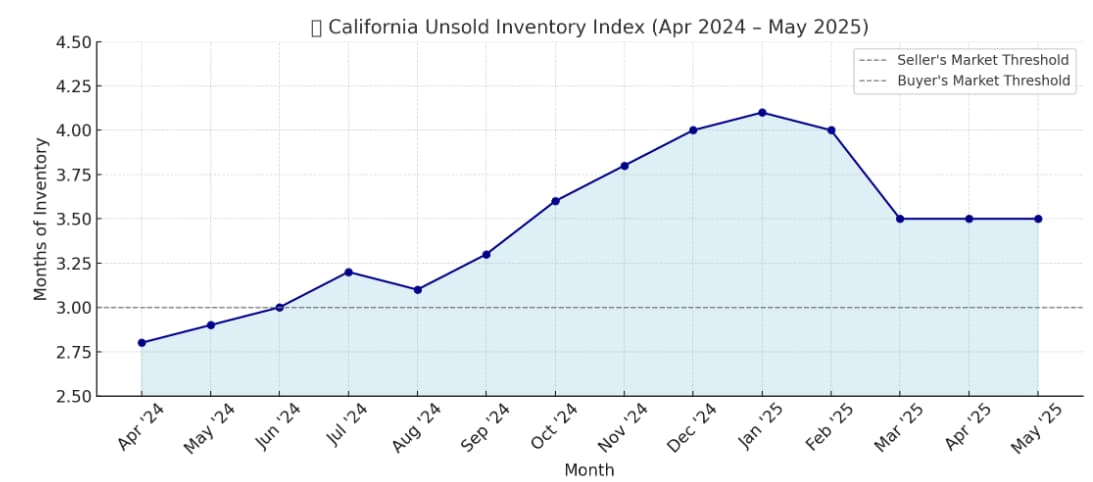
Another indicator is the Unsold Inventory Index (UII), which measures the number of months it would take to sell the current housing inventory at the current sales pace; assuming no new homes are listed for sale. The calculation is simply the number of active listings divided by monthly home sales. April’s UII came in at 3.5 and May is forecasted to be about the same.
What this Index Tells You:
-
Low UII (1–3 months): Seller’s market – homes are selling quickly, and inventory is tight.
-
Balanced UII (4–6 months): Neutral market – supply and demand are roughly even.
-
High UII (7+ months): Buyer’s market – more inventory, slower sales pace.
Referring to the chart below we can see that this index has trended upwards over the last year and has shifted from a seller’s market to a neutral market. This trend puts buyers in a comparatively stronger negotiating position. (more on that later)
|
 |
What are Contributing Factors for the Increase in CA Home Inventory for Sale?
-
Affordability Challenges: Elevated home prices have strained affordability, leading some buyers to delay purchases. In Q1 2025, only 17% of California households could afford the $846,830 median-priced home, up from 15% in Q4 2024.
Key Affordability Statistics:
💰Monthly Payments: For a mid-tier home, monthly payments were nearly $5,900 in March 2025, an whopping 82% increase since January 2020.
💰Income Requirements: An annual household income of about $234,000 is needed to qualify for a mortgage on a mid-tier home; over twice the median California household income of $96,500 in 2023.
Another indicator is the Unsold Inventory Index (UII), which measures the number of months it would take to sell the current housing inventory at the currez; nt sales pace; assuming no new homes are listed for sale. The calculation is simply the number of active listings divided by monthly home sales. April’s UII came in at 3.5 and May is forecasted to be about the same.
What this Index Tells You:
-
Low UII (1–3 months): Seller’s market – homes are selling quickly, and inventory is tight.
-
Balanced UII (4–6 months): Neutral market – supply and demand are roughly even.
-
High UII (7+ months): Buyer’s market – more inventory, slower sales pace.
The Unsold Inventory Index (UII) stood at 3.5 months, down from 4.0 months in February but up from 2.6 months in March 2024 .instamortgage.com+3car.org+3noradarealestate.com+3
Key Drivers:
-
New Construction: Counties like San Benito have led in housing growth, with a 9% increase driven by developments in areas such as Hollister.
-
Seller Activity: High mortgage rates and economic uncertainties have prompted more homeowners to list their properties, contributing to the inventory uptick.,
Home Prices
-
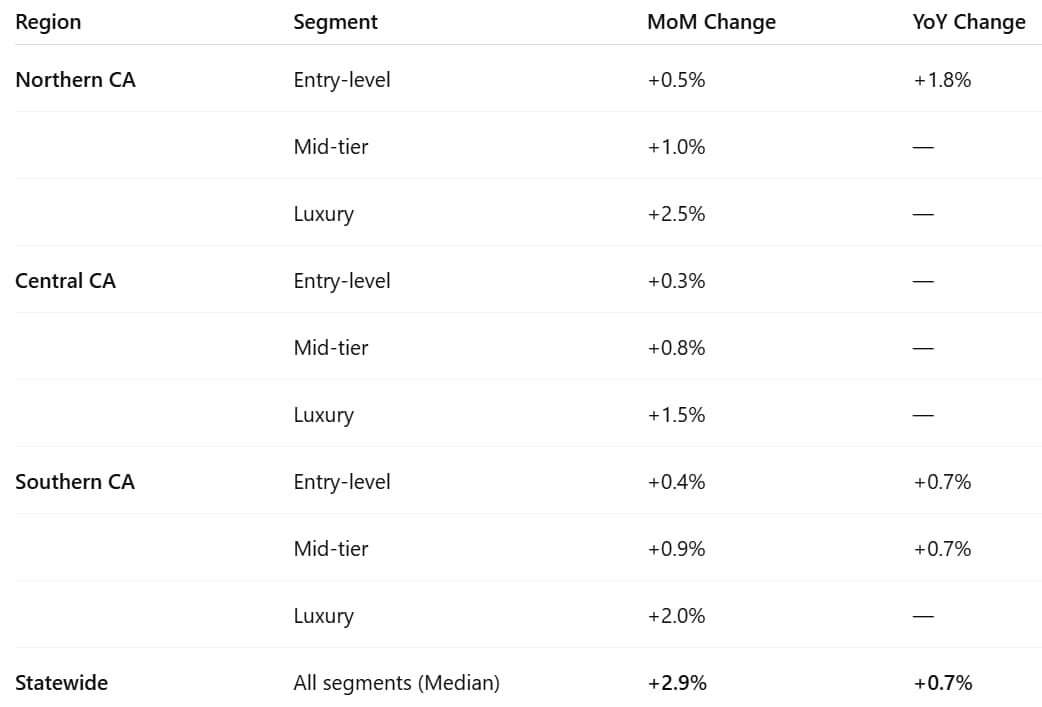
CA Statewide: Median home price reached $910,160 in April, up 2.9% on a month-over-month basis and 0.7% year-over-year.
-
Northern CA (Bay Area): Median home price was about $2.235M in April, a 1.8% increase year-over-year.
-
Southern CA (6-county region): Median home prices averaged $884,981, up 0.4% month-over-month and 0.7% year-over-year.
Breaking things down even further in the table below, we see that the higher-end luxury segment of the housing market experienced the largest increase.
|
 |
|
🔑 Key Takeaways for Buyers and Sellers
For Buyers:
-
Seller Concessions are Prevalent: In the first quarter of 2025, 44.4% of U.S. home-sale transactions included seller concessions, just shy of the record 45% rate in 2023. A few examples of how buyers benefit from seller concessions include the following:
-
Closing Cost Assistance: Sellers covering a portion of buyers’ closing costs.
-
Mortgage Rate Buydowns: Temporary reductions in interest rates to ease buyers’ initial payment burdens.
-
Home Repairs or Credits: Sellers addressing home inspection findings or offering credits for future improvements.
-
Negotiation Opportunities: Increased inventory and seller concessions provide leverage to negotiate favorable terms.
-
Affordability Strategies: Consider exploring down payment assistance programs and focusing on less competitive markets.
For Sellers:
-
Competitive Pricing: Accurate pricing is crucial to attract buyers in a market with growing inventory.
-
Offering Concessions: Providing incentives can make listings more appealing in a market where buyers have more choices.
|
|
|
|
|
|
|