Mortgage Matters 10-27-25


Mortgage Matters With Integrity

Insights on Mortgage Rates, Refinance Strategies, and Market Trends

Written & Prepared by:  Brian Tilton

October 27, 2025


The Market’s Crystal Ball:  
Expectations vs. Reactions in a Fed-Driven World

As a borrower navigating the world of home financing, it’s essential to grasp how mortgage rates truly operate in financial markets. Many people assume that mortgage rates simply follow the Federal Reserve’s Federal Open Market Committee’s (FOMC) announcements, rising or falling in direct response to the Fed’s decisions on interest rates. However, the reality is more nuanced and forward-looking.  Mortgage rates are shaped by the market’s collective expectations of future economic conditions, usually adjusting well in advance of any official Fed action.  In this article, we’ll delve into this concept in depth, explaining the mechanisms at play, the differences between short-term Fed rates and long-term mortgage rates, and why post-announcement adjustments can sometimes seem counterintuitive.  By the end, you’ll be better equipped to time your mortgage decisions wisely—perhaps saving you from the frustration of watching rates move in unexpected ways.


The Basics: What the FOMC Does and How It Relates to Mortgages

To start, let’s clarify the role of the FOMC. The Federal Open Market Committee is a key arm of the Federal Reserve, responsible for setting the target range for the federal funds rate. This rate is essentially the interest rate at which banks lend money to each other overnight—think of it as a one-day loan between financial institutions. It’s a short-term benchmark designed to influence broader economic activity by making borrowing cheaper or more expensive in the near term.

In contrast, the most common type of mortgage in the U.S. is the 30-year fixed-rate mortgage, which locks in an interest rate for three decades. This long-term commitment means that mortgage rates aren’t directly tied to the fed funds rate in a mechanical way.  Instead, they are influenced by the yields on long-term Treasury bonds, particularly the 10-year Treasury note, which serves as a proxy for investor expectations over extended periods.

While the fed funds rate and mortgage rates operate on different timelines—one short-term and one long-term—they both respond to the same underlying economic factors. These include:

  • Inflation Expectations:  If markets anticipate rising inflation, long-term rates like mortgages increase to compensate lenders for the eroding value of money over time. The Fed might hike short-term rates to combat this, but markets often price in such moves far ahead of time.

  • Economic Growth:  Strong growth signals, such as robust GDP reports, can push rates higher as they suggest a healthier economy that might overheat, leading to inflation.

  • Unemployment Trends:  Lower unemployment often correlates with wage growth and potential inflation, influencing both short- and long-term rates. Conversely, rising unemployment might signal a slowdown, prompting expectations of Fed rate cuts.

  • Global Events and Geopolitical Risks:  Factors like international trade tensions or oil price shocks can sway investor sentiment, affecting Treasury yields and, by extension, mortgage rates.

​​These shared drivers mean that while the Fed’s actions can provide a nudge, the market’s forward-looking nature often steals the show. As the saying goes, the market doesn’t wait for permission—it anticipates.

The Forward-Looking Nature of Mortgage Rates

Here’s where the “forward-looking” aspect comes into sharp focus:  Mortgage rates don’t react solely to what the Fed does today; they incorporate what investors expect the Fed and the economy to do in the future.  Bond traders, institutional investors, and economists analyze a wealth of data— from CPI (inflation) reports to employment figures—to form predictions. These expectations are priced into current rates through trading in the bond market.

For instance, if economic data suggests inflation is cooling faster than anticipated, markets start pricing in an increased probability of a Fed rate cut weeks or even months before the FOMC meets.  Mortgage rates repond by declining in anticipation, reflecting the heightened probability of lower future short-term rates rippling through the economy.  By the time the Fed announces its decision, its old news—most, if not all, of the movement has already occurred.

I don’t want to get too deep into financial theory, but this preemptive adjustment is driven by efficient market hypothesis principles:  Prices reflect all available information almost instantly.  In practice, this means borrowers might see rates drop in the weeks leading up to a Fed meeting if a rate cut is widely expected. However, if the actual announcement aligns perfectly with those expectations, rates might remain stable or even tick up slightly due to a “sell the news” effect—where traders lock in profits after the anticipated event materializes.

The Post-Announcement “True-Up” Adjustment

Once the FOMC makes its announcement—typically after a two-day meeting held eight times a year—there’s often a brief period of volatility known as the “true-up.” This is when rates adjust based on how the decision compares to market expectations. If the Fed cuts rates by 0.25% but the market had assigned a small probability to a more aggressive 0.50% cut, mortgage rates might actually rise that day.  Why?  Is the market behaving irrationally?  Not all all.  The smaller rate cut signals to investors that the economy might not need as much stimulus as feared.  Yes, the Fed Funds rate may now be lower, but not as much as the market was expecting—causing a recalibration.

Conversely, if the Fed surprises with a larger-than-expected cut—say, 0.50% when only 0.25% was priced in—mortgage rates could rally and fall further as market recalibrate to a more stimulative policy stance. This true-up can happen within minutes of the announcement, amplified by algorithmic trading and real-time data feeds.

Media coverage often exacerbates the perception of reactivity. Headlines like “Fed Cuts Rates: What It Means for Your Mortgage” flood the airwaves immediately after an announcement, creating the illusion that the Fed is directly pulling the strings. In truth, by the time you read those stories, the market has likely already digested the news, and any significant rate changes occurred in the preceding days or weeks. As a borrower, this means tuning out the hype and focusing on broader trends rather than day-to-day fluctuations.

Real-World Examples: Lessons from Recent Fed Cycles

To make this concrete, consider historical patterns. During the post-pandemic recovery in 2022-2023, as inflation surged, mortgage rates climbed from around 3% to over 7% well before the Fed’s aggressive rate-hike cycle peaked. Markets anticipated the Fed’s moves based on soaring CPI data, leading to preemptive rate increases.

More recently, in the lead-up to the FOMC’s September 2025 meeting (as of this writing in October 2025), markets had priced in a 94% probability of a 0.25% rate cut, and a 6% probability of a  0.50% rate cut.  When the Fed announced their 0.25% cut, rates worsened  (increased) slightly within several minutes of the announcement.  When people saw the news later that day they were expecting an improvement in mortgage rates, but the reality is that the improvement had already taken place in the several weeks preceding the announcement.

The table below summarizes the last 10 FOMC decisions as well as the market’s subsequent reaction on that day.  Solely looking at the rate decision and the market reaction it would seem that the market reacted illogically.  But now that you understand that the market had already adjusted in the preceding weeks, and merely had a “true-up” on the day of the Fed decision, it makes more sense.

Historical Fed’s FOMC Decision & Market Reaction

Date How it Benefits You Market Expectations Going In 10-Year UST Yield Reaction (Net Change)
9/17/25 Cut 0.25% to 4.00%-4.25% 95% chance of  0.25% cut; ~6% chance of 0.50% cut, with focus on softening jobs data Rose ~4-5 basis points to ~4.07%
7/30/25 Hold at 4.25%-4.50% Expected hold; ~60% probability of signaling future cuts, amid steady inflation cooling Rose ~4-6 basis points to ~4.37%
6/18/25 Hold at 4.25%-4.50% Expected hold; markets priced in 1-2 cuts by year-end per dot plot and futures Essentially flat at ~4.39%
4/30/25 Hold at 4.25%-4.50% Consensus hold; attention on dot plot revisions for fewer cuts in 2025 Fell ~2-4 basis points to ~4.40%
3/19/25 Hold at 4.25%-4.50% Widely expected hold; focus on inflation persistence, with two cuts anticipated later in 2025 Fell ~3-6 basis points to ~4.25%
1/29/25 Hold at 4.25%-4.50% Expected hold to start the year; markets assigning ~80% probability based on strong Q4 2024 growth Flat to slightly down at ~4.30%
12/11/24 Cut 0.25% to 4.25%-4.50%Cut 0.25% to 4.25%-4.50% High probability (~90%) of 0.25% cut; some debate on pause if data surprised hot Rose ~3-5 basis points to ~4.20%
10/30/24 Hold at 4.50%-4.75% Expected hold post-September cut; markets eyeing election impacts and data for December move Fell ~4-7 basis points to ~4.15%
9/18/24 Cut 0.50% to 4.50%-4.75% Strongly anticipated 0.50% cut (~70% probability); alternative was 0.25% if jobs held firm Essentially flat at ~4.20%
7/31/24 Hold at 5.25%-5.50% Consensus hold; building expectations for September cut amid cooling inflation Rose ~2-4 basis points to ~4.30%

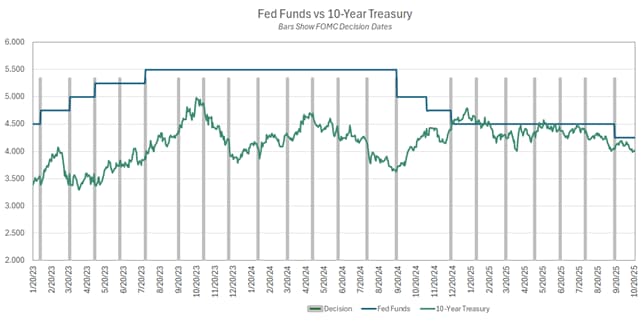
As another illustration, the chart below shows the federal funds rate along with the 10-Year Treasury.  The bars show the days when an FOMC rate decision was announced.  Scrutinizing this you’ll see that 1)  the 10-Year Treasury movements precede the subsequent fed funds changes.  2)  There are other factors beyond the fed decisions that impact Treasury rates.

Practical Advice for Borrowers: Navigating the Forward-Looking Market

As a prospective or current homeowner, this knowledge empowers you to make informed decisions rather than chasing headlines. Here are some actionable tips:

1.      Monitor Economic Indicators Proactively:  Keep an eye on key reports like the monthly jobs data, CPI releases, and GDP figures. These often move markets more than the Fed itself. For example, a surprisingly strong jobs report could push rates higher, even if the Fed is in a cutting cycle.

2.      Use Rate-Lock Strategies Wisely:  If you’re buying a home, consider locking in your rate early to avoid risk that rising rates could jeopardize eligibility.

3.      Refinance with Foresight:  For refinancers, don’t wait for the Fed to act. If rates have already declined in anticipation of a cut, seize the opportunity.

4.      Consult Professionals: Work with a mortgage advisor who understands finance and market dynamics; not a slick salesperson. They can provide personalized insights, such as evaluating various loan options to optimize your borrowing costs in light of expected rate changes.

In essence, viewing mortgage rates through a forward-looking lens shifts the focus from reactive Fed-watching to proactive economic awareness.  By staying informed, you position yourself not just as a borrower, but as a savvy participant in the financial ecosystem. If rates seem perplexing, remember—they’re pricing tomorrow’s economy today.

Interest Rate Trends

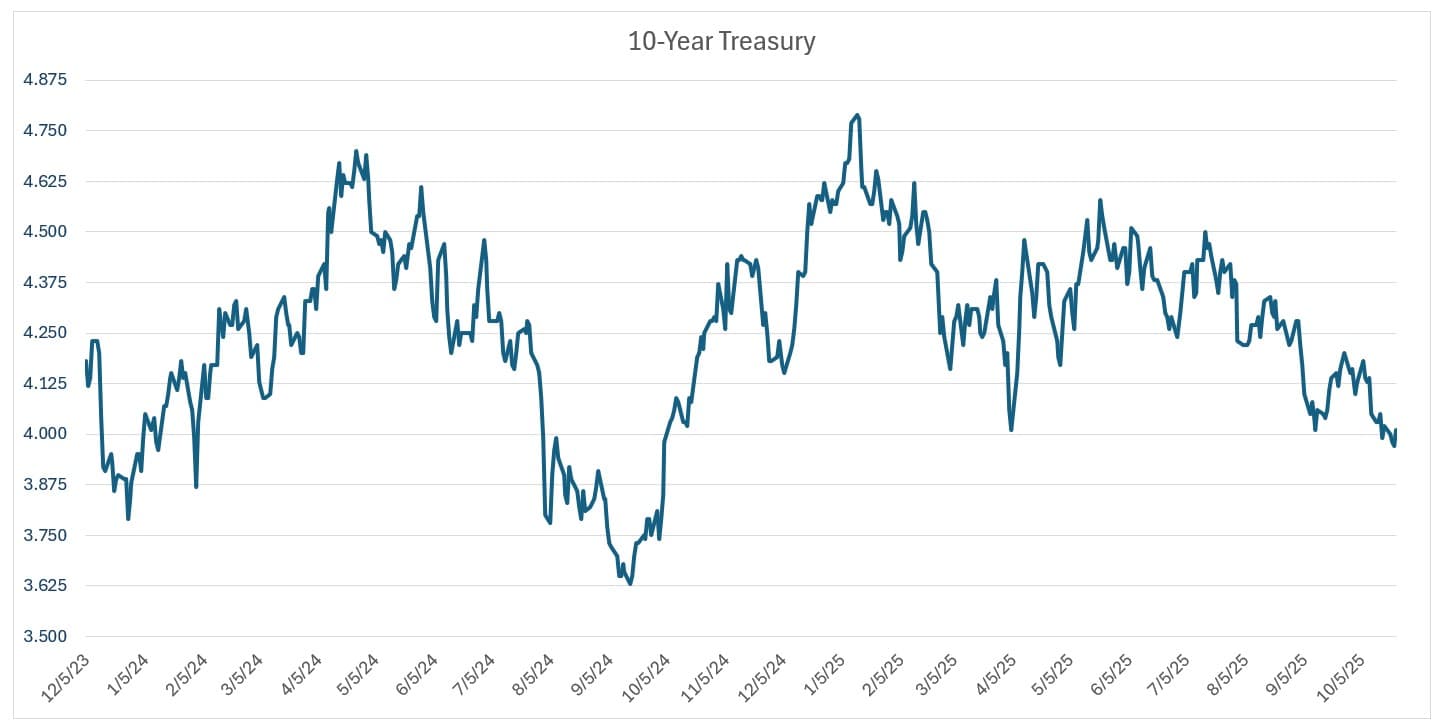
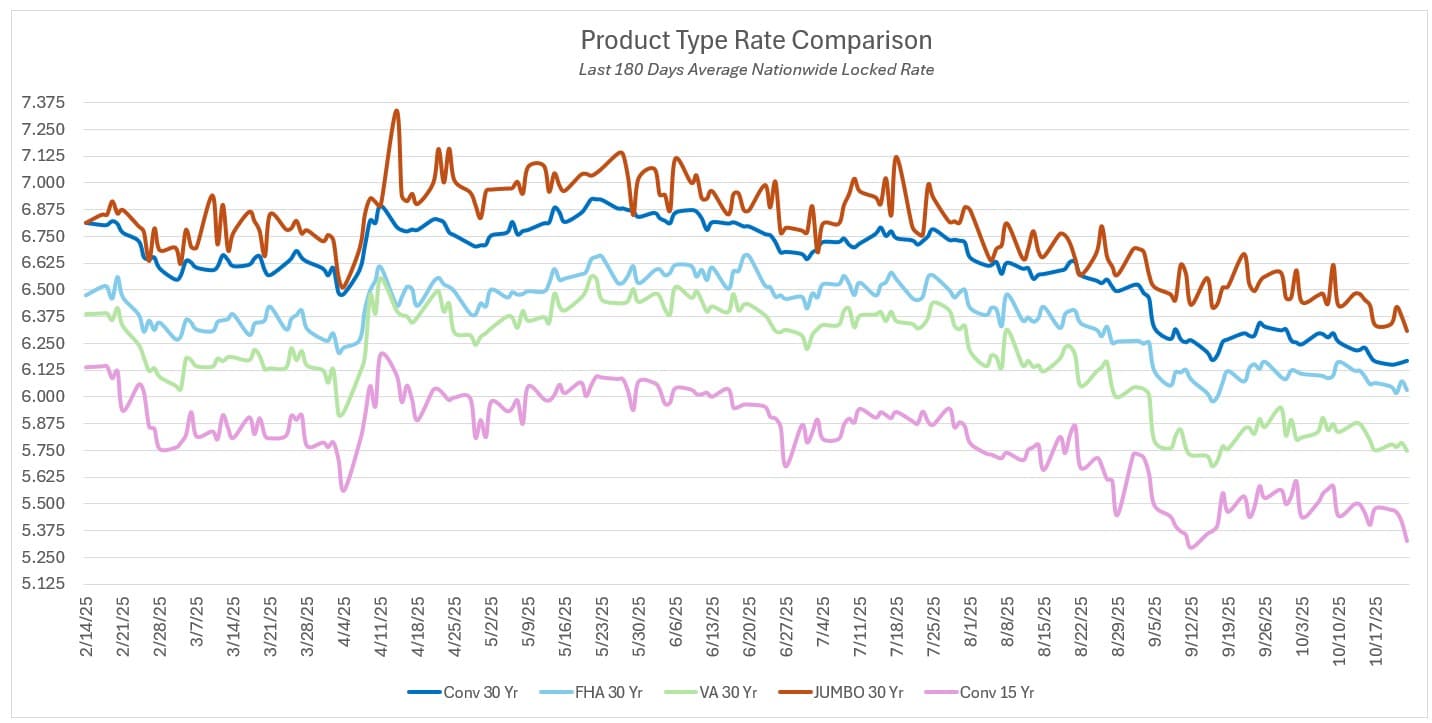
Since our last newsletter we’ve witnessed a much welcome decline in rates, which are at their lowest levels in over a year. This softening trend reflects a broader economic shifts toward stability and colling inflation. Let’s break it down and explain the “why” behind these movements.

Changes Since September 5, 2025

  • 30-Year Fixed (Conventional): Down 0.27%.  30 year products are the most responsive to long-term yield shifts, providing the most noticeable relief for buyers.

  • 15-Year Fixed: Down 0.24%

  • 5/1 ARM: Down 0.20%.  Adjustable rate mortgages have trailed fixed rates slightly, since shorter-term indices haven’t fallen as sharply.

  • FHA/VA/Government Loans: Down 0.25% – 0.30%, tracking conventional closely but with VA often gaining an extra edge due to no PMI.

Mortgages vs. Treasuries: Performance and Yield Curve Insights

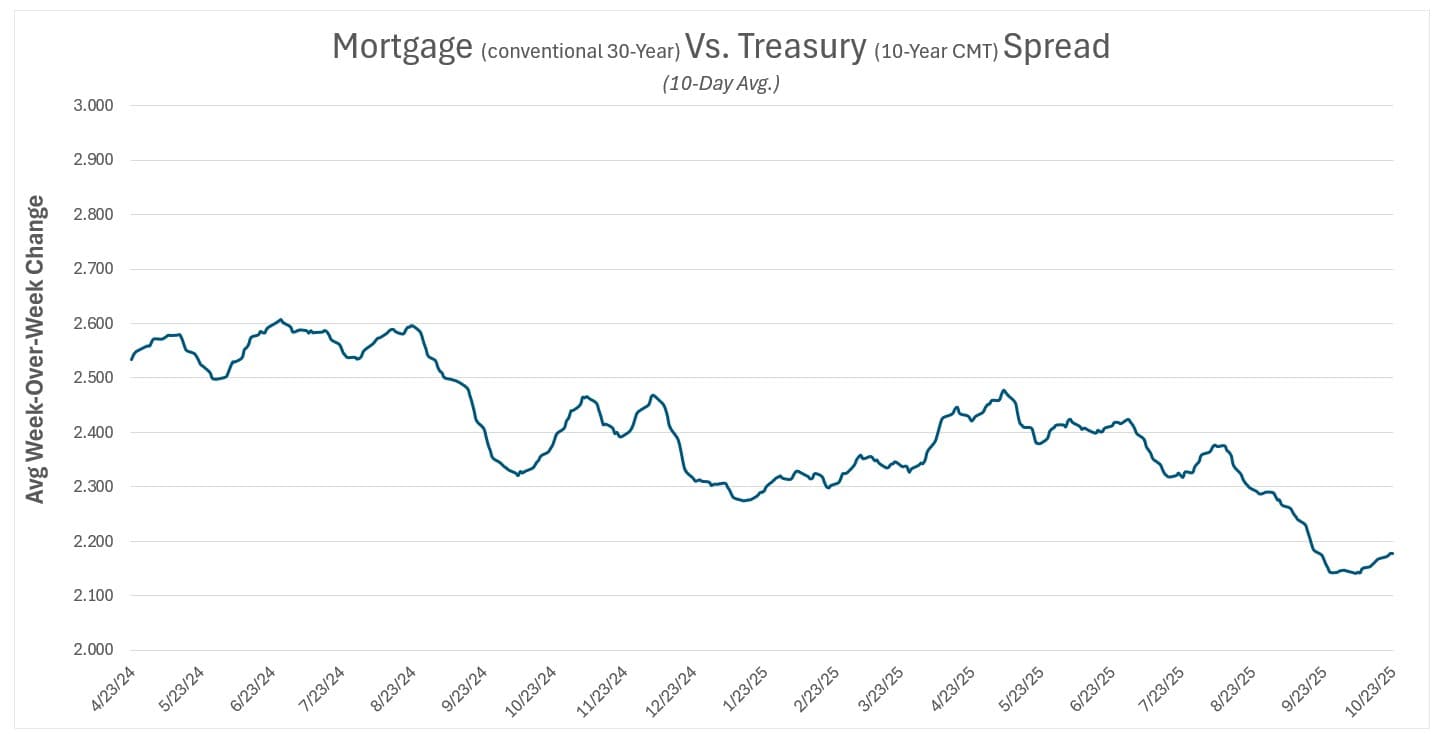
Mortgages have tracked Treasuries closely, though the spread (premium over treasuries) has widened about 2.2 basis points. Why? The declining rates have increased the likelihood of borrowers prepaying (refinancing), thereby lowering yields for investor’s mortgage backed securities; thus reducing demand.  The yield curve has steepened notably, with short-term yields (2-year Treasury) dropping 0.6 points since early September (from ~4.1% to 3.5%), outpacing long-term (10-year down 0.4 points to ~3.9%). This reflects market confidence in Fed easing without deep recession fears. Conventional loans mirrored FHA/VA performance, but government products shine in affordability with lower fees.

ARMs versus fixed? Fixed rates improved more, as long-end yields benefit from inflation’s retreat; ARMs, tied to SOFR, saw muted gains.  The spread between a 5/1 ARM and 30-year fixed has held steady at about 0.6 points (ARM lower), consistent with historical norms around 0.5–1 point. The 30-year’s larger decline stems from greater sensitivity to falling long-term yields.

Why Rates Changed: Key Drivers and News

  • Economic Data: September CPI dipped to 2.4% (from 2.9%), bolstering rate cut expectations; yet resilient retail sales (+0.4%) and GDP projections (2.5% Q3) tempered sharper drops.

  • Global Factors: Easing geopolitical tensions and stable energy prices supported bond demand, while stock market resilience avoided flight-to-safety spikes.

  • Market Sentiment: Investors flocked to Treasuries post Fed rate cut, lowering yields—but mortgage spreads held wide due to lender hedging.

Longer-Term Trends

  • Last 30 Days: Down 0.15 points—post-Fed calm with data-driven wobbles, like a brief uptick after strong September jobs (+254k).

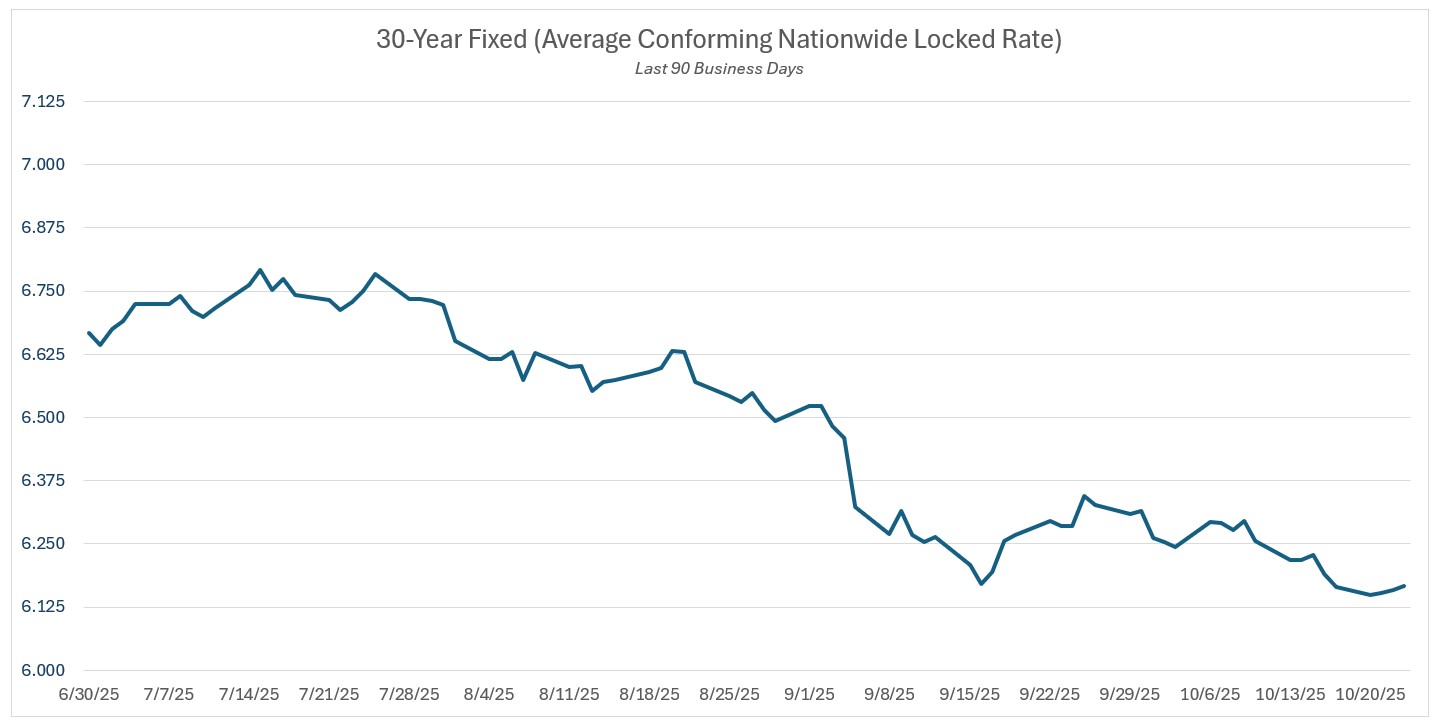
  • Last 90 Days: Down 0.55 points from late July highs near 6.8%, fueled by inflation’s slide (3.0% to 2.4%) and Fed pivot from holds to cuts.

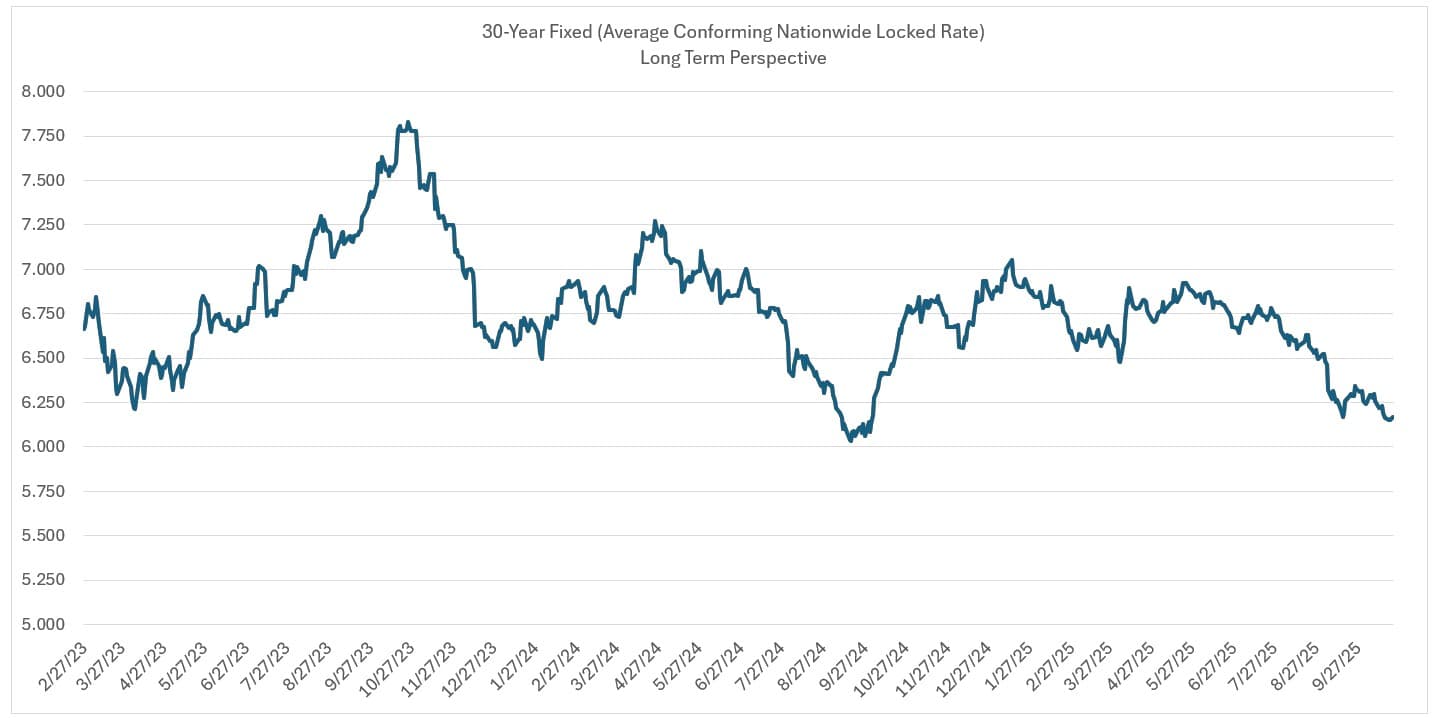
  • Last 180 Days: Down 0.85 points from spring peaks above 7%, as GDP cooled (3.4% Q1 to 2.5% Q3) and supply chains normalized post-COVID, taming inflation and enabling

Fed Watch

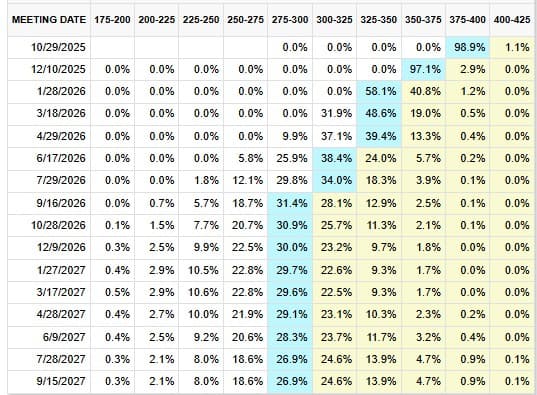
The next Federal Open Market Committee (FOMC) meeting is set for October 29th, and markets are taking it as a foregone conclusion that a rate cut is imminent.  Extrapolating from where fed funds futures are trading, there’s a staggering 98.9% probability of a 25 basis point cut in the federal funds rate, bringing it down from the current 4.00%-4.25% range to 3.75%-4.00%.  Let’s unpack the why, the what-ifs, and the wild cards.

What’s Driving the Shift in Rate Cut Probabilities?

  • Jobs Resilience: September’s +254k payrolls smashed expectations (+150k), with unemployment dipping to 4.1%—signaling no recession, but not overheating. This cooled speculation of  more stimulative 0.50% rate cut.

  • Inflation Cooling: CPI fell to 2.4% year-over-year, but core stuck at 3.2%, keeping the Fed cautious. The Fed’s favorite economic indicator, PCE (personal consumption expenditures price index), which tracks what households actually pay for goods and services, came in at +2.5% which supports easing, but not a 50 basis point cuts.

  • Other Data: Strong retail sales (+0.4%) and GDP estimates (2.5%) show consumer strength.  The government shutdown has caused delays in some data being reported, stoking uncertainty and speculation. Geopolitics? Stable, but any oil spike could flip the script.

Market Reactions: What If the Fed Cuts… or Doesn’t?

If the Fed cuts 0.25% (likely), expect a mild bond rally: Mortgage rates could improve 0.1–0.2%, stocks up 0.5–1%, as it affirms the soft landing. No fireworks—just steady progress toward neutral rates. But its important to understand, it’s not just the Fed action itself that moves the needle; the Fed’s post-meeting statement, dot plot updates, and Chair Powell’s press conference comments—or even subtle hints about future policy—can be the real wildcard, sometimes overshadowing the cut altogether. For instance, if they signal more aggressive easing ahead (like “we’re ready for bigger moves if needed”), markets could amplify the rally, dropping rates further; but hawkish vibes (“inflation risks remain elevated”) might mute or reverse gains, even with a cut. In the unlikely event that the Fed holds steady (that 1.1% chance), markets might go into a tailspin with rates spiking 0.25–0.5%, as it signals hotter inflation fears.

Additional Rate Cuts on the Horizon?

One more cut is projected for 2025 (December 11th), totaling three for the year (including September). But estimates are fluid and fluctuate of a daily basis.  Strong jobs/inflation could take a potential cut off the table; weak data (e.g., sub-100k payrolls) might result in a more stimulative cut. Watch PCE, NFP, and shutdown resolutions—these could swing odds 10–20%.


Next FOMC Meeting:  Wednesday, October 29th

 Current Fed Funds Rate Range:  4.00% – 4.25%

Fed Funds Probabilities Table

How to Interpret:  The top row lists fed fund rate ranges.  The left-most column lists upcoming dates for FOMC rate cut decisions.  The values represent the probability of the fed funds rate lying in that range.  Each row will sum to 100%.  The probabilities are market-based and derived from the prices where futures contracts are trading.


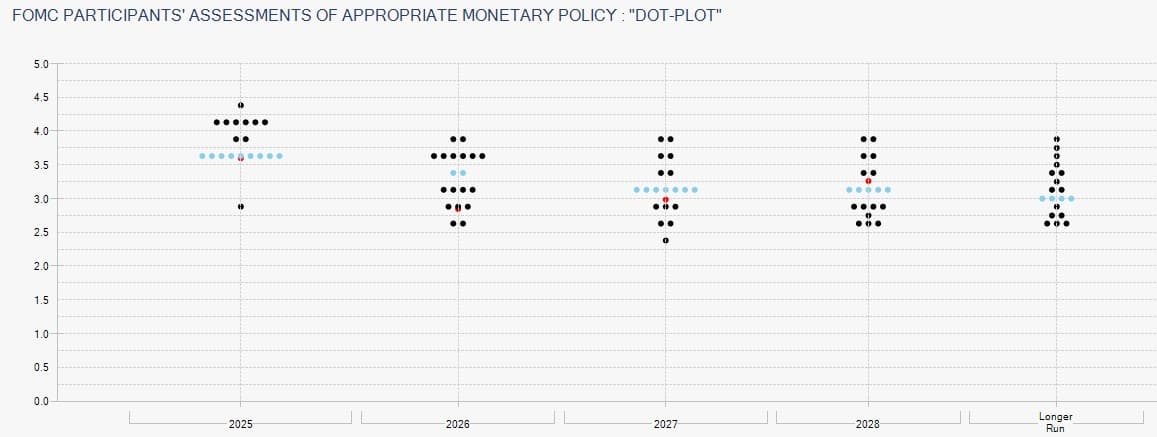
How to Read the Fed’s Dot Plot (chart below)

Each dot represents one FOMC member’s forecast.

● There are 19 participants in the dot plot:

  1. ▪︎ 7 Fed Board Governors (nominated by the President and confirmed by the Senate

  2. ▪︎ 12 Regional Fed Bank Presidents

● The red dot shows the market’s forecast, based on the price where futures are trading.

● The blue dots represent the median forecast.

● The greater the dispersion in the dots, the less consensus between the participants.

Usefulness for Borrowers:  Provides an educated indication of where the Fed Funds rate may be in future years.

Economic Calendar


Question:  Why should I stay abreast of upcoming economic news?

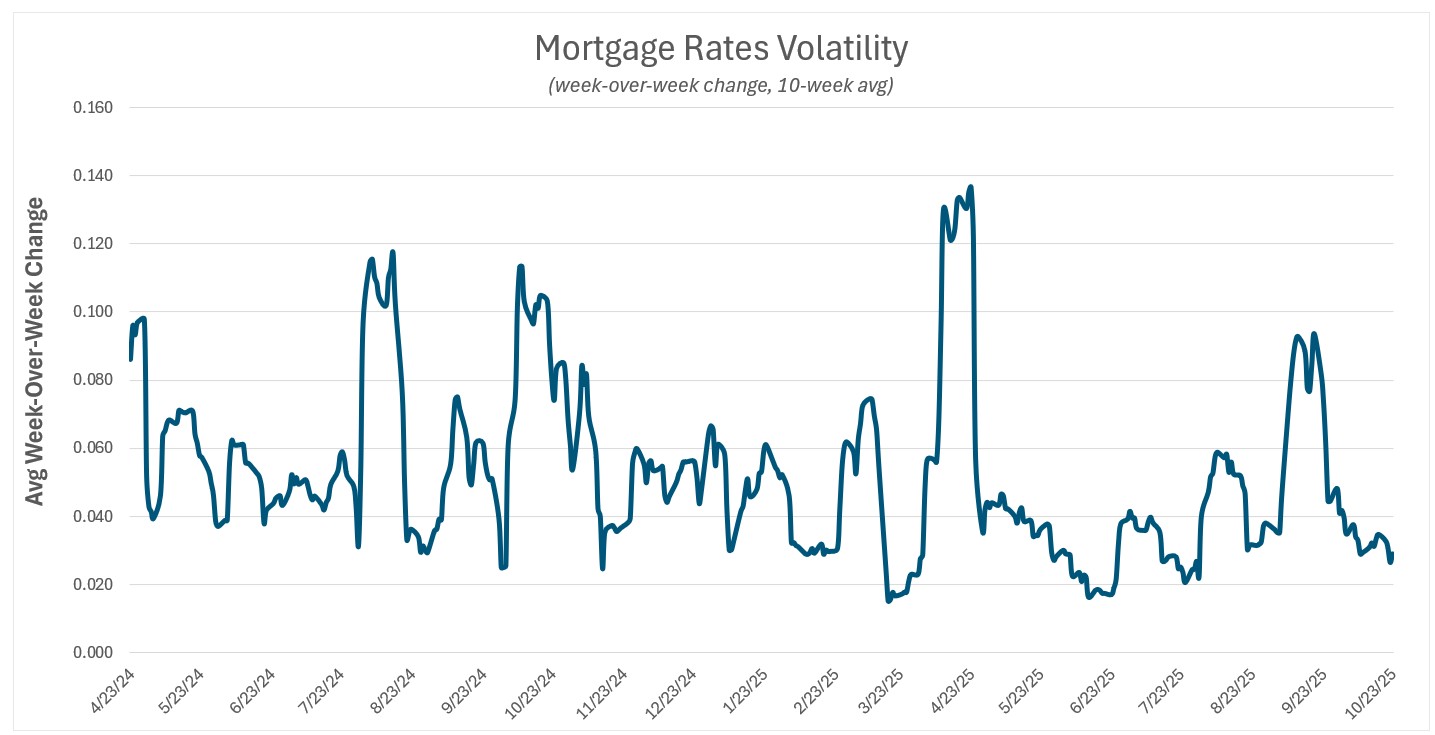
Answer: Financial markets react to disparities between expected versus actual economic data.  On days where highly anticipated economic data is released there is a greater likelihood of heightened volatility (risk).  This is particularly relevant if you are locking in a rate.

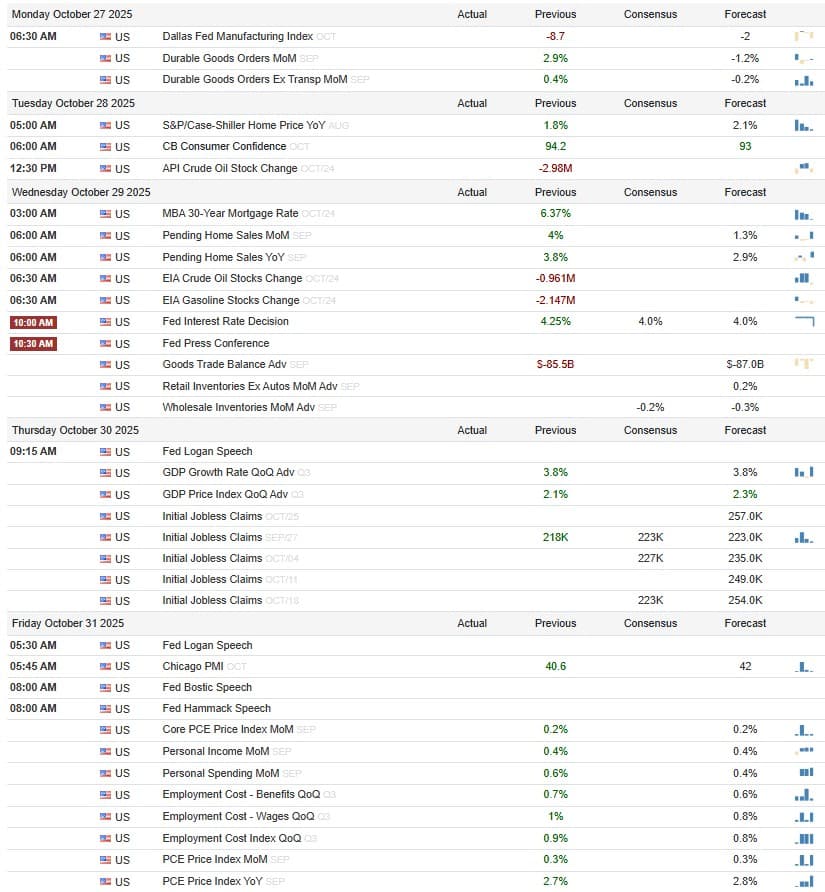
Here’s a rundown of this week’s key economic data being released  — what’s coming & why it matters (the full calendar is at the end of this section):

  • What: Jolts Job Openings (JOLTS).  Tracks job vacancies, hires, and quits. It’s like peeking into the job market’s “help wanted” signs—high openings suggest a tight labor market, which can fuel wage growth and inflation.

  • When: Tuesday, October 28, at 7:00 AM PST

  • Volatility Risk: 🔥🔥 (Moderate)

  • Market’s Expectation: Around 7.6 million openings, down slightly from last month.

  • What to Watch For:  If openings exceed expectations, it could hint at persistent wage pressures; below expectations could ease inflation fears.

  • Significance for Mortgage Rates: A hotter-than-expected report might widen mortgage spreads to Treasuries, increasing rates up 0.1–0.2%. Weaker data? Rates could dip, lowering borrowing costs for homebuyers.

  • What: Advance GDP (Q3).  Measures the total value of goods and services produced. It’s the economy’s report card—strong growth means we’re firing on all cylinders, but it can also mean rising inflation. (This is the preliminary GDP number)

  • When: Wednesday, October 29, at 5:30 AM PST

  • Volatility Risk: 🔥🔥🔥 (High)

  • Market’s Expectation: 2.5% annualized growth, a slowdown from Q2’s 3.0%.

  • What to Watch For: Components like consumer spending (70% of GDP) and investment; surprises here could shift Fed bets.

  • Significance for Mortgage Rates: If GDP exceeds expectations, expect upward pressure on rates as investors anticipate less Fed easing. A lower than expected number could lower rates by 0.1–0.3%, signaling an economic slowdown. This release is a biggie for long-term rate trends since it ties directly to the Fed’s dual mandate.

  • What: PCE Price Index.  The Personal Consumption Expenditures (PCE) Price Index is the Fed’s preferred inflation gauge, tracking price changes in what consumers buy. Core PCE excludes food and energy for a clearer view of underlying trends.

  • When: Thursday, October 30, at 5:30 AM PST

  • Volatility Risk: 🔥🔥🔥 (High)

  • Market’s Expectation: Headline PCE at 2.3% year-over-year, core at 2.6%—edging toward the Fed’s 2% target.

  • What to Watch For: Month-over-month changes; anything above 0.2% could reignite inflation worries.

  • Significance for Mortgage Rates: Hotter inflation might spike rates by 0.2% or more, as it reduces odds of Fed cuts. Cooler readings? Rates could soften, benefiting refinancers. This is prime for mortgage volatility—Have it on your radar if contemplating locking in your rate.

  • What: Nonfarm Payrolls.  The monthly jobs report tallies nonfarm payroll additions, unemployment rate, and wage growth. It’s the labor market’s headline act—strong jobs mean a healthy economy, but too hot can delay rate cuts.

  • When: Friday, October 31, at 5:30 AM PST

  • Volatility Risk: 🔥🔥🔥 (High)

  • Market’s Expectation: +150,000 jobs added, unemployment steady at 4.1%, wages up 0.3% month-over-month.

  • What to Watch For: Revisions to prior months and participation rate; wage growth above 4% year-over-year could alarm the Fed.

  • Significance for Mortgage Rates: A blockbuster report (e.g., +200k jobs) might hike rates 0.2–0.4% by signaling no rush for cuts. Softer data? Rates drop, potentially unlocking better deals. This is the week’s showstopper—could cause the biggest swings, especially post-Fed meeting.

Housing Corner

Recent data shows a cooling pace, more inventory, and stabilizing prices, creating buyer-friendly conditions. The root causes?  Primarily low affordability driven by escalating everyday costs, which have strained household budgets and shifted buyer behavior.  In California, where the cost of living is among the nation’s highest, factors like soaring utilities (up due to regulatory mandates and energy transitions), elevated gas prices (averaging $4.50/gallon amid supply constraints), and food inflation (groceries up 25% since 2020) have made saving for down payments tougher, leading to fewer home offers and homes remaining on the market for longer.  In Texas, while generally more affordable, rising property insurance premiums (spiked by climate risks like storms), utilities tied to volatile energy markets, and food costs have pinched wallets, especially in growing metros.  For potential homebuyers: Interpret this as a window to negotiate—more choices mean less bidding wars, and sellers are offering concessions. Affordability remains a hot topic: Nationally, 75% of households can’t afford median new homes

Recent Changes and Trends

  • Home Prices: In September 2025, CA’s median hit ~$866,100 (up 4–5% year-over-year), while TX dipped 1.4% year-over-year to ~$375,000. Last 10 years? Both surged: CA +98% (from ~$440k in 2015), TX +94% (from ~$200k), driven by population booms and supply shortages pre-2022. Recent stabilization: Affordability woes have cooled speculation, with CA seeing drops in 21 counties as buyers pull back.

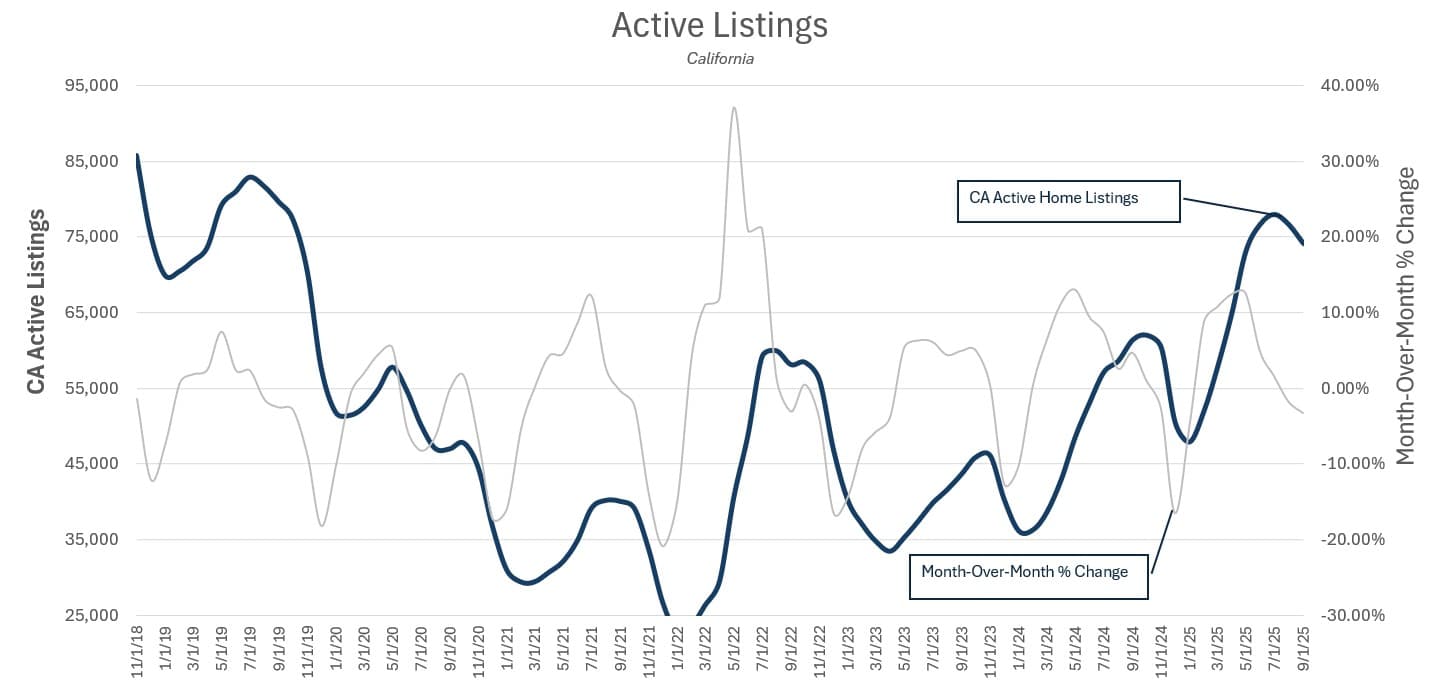
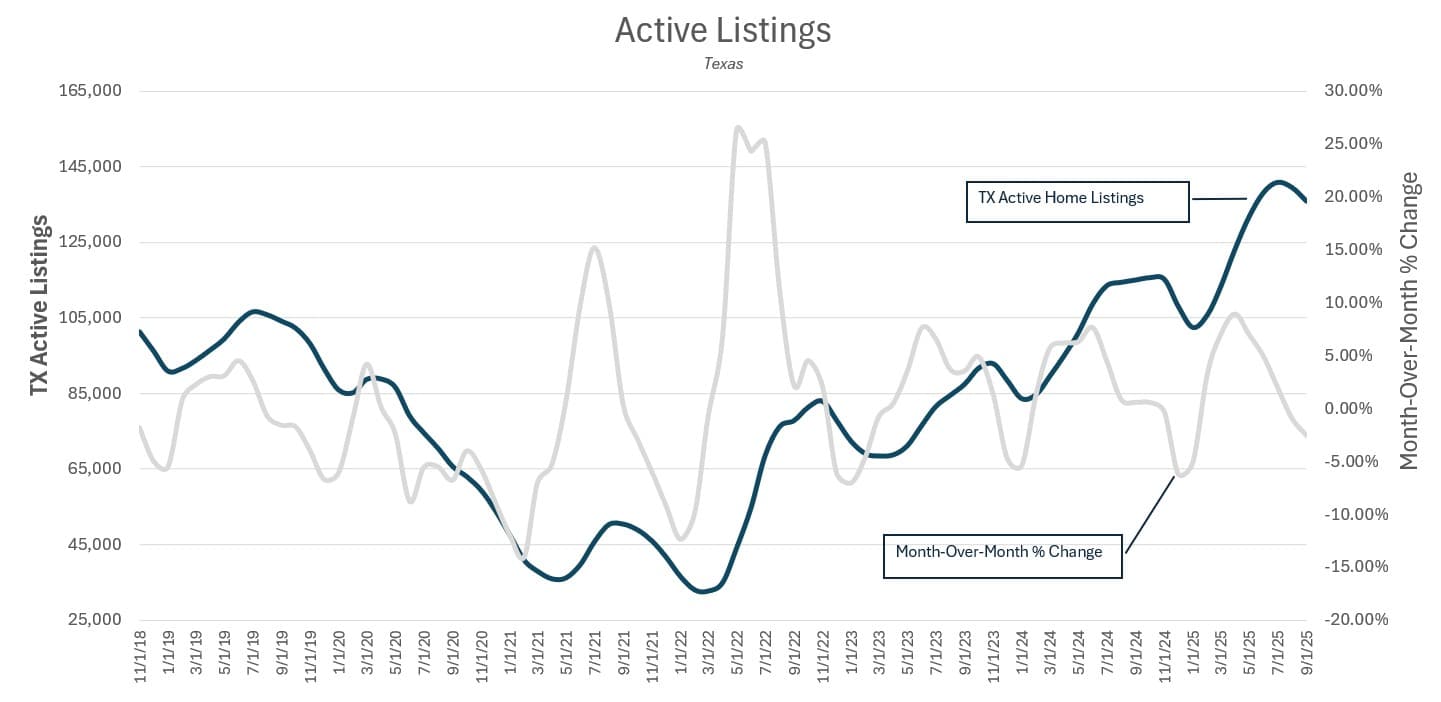
  • Inventory Levels: CA active listings ~74,140 (up 20% year-over-year), TX up 10.4%—national trend of 20.9% growth, easing shortages from pandemic lows.

  • Pace of Home Sales: CA sales up 6.6% year-over-year to 277,410 (seasonally adjusted annual rate); TX up 3.1%. National up 7%.

  • Days on Market: CA median 52 days (up from 40 in 2024), TX 70 days (up 11 days year-over-year).

Future Expectations and Contributing Factors

Expect modest price growth (2–4% in 2026) with inventory rising 10–15%. Factors: In CA, exclusionary zoning and high cost of living continue to limit supply, but migration out of the state could add listings; TX benefits from pro-growth policies like rezoning reforms, though insurance hikes (up 20-30% in storm-prone areas) may temper demand. Buyers: This means more negotiating power—aim for concessions like closing cost help.


Leave a Reply

Your email address will not be published. Required fields are marked *

Apply Now