Mortgage Matters With Integrity
|
|
|
|
Written & Prepared by: Brian Tilton
|
|
|
|
|
|
|
|
FHA Streamlines:
Unlock Savings with a Simplified Approach
|
|
|
|
Who wouldn’t welcome a hassle-free, budget-friendly approach to reducing your mortgage payment—like all green lights on your drive to work, or finding an extra $20 in your coat pocket? That’s the essence of FHA Streamline Refinances, a program launched by the Federal Housing Administration in the 1980s to help everyday homeowners like you lower monthly payments or snag better terms on an existing FHA-backed mortgage. All with less red tape and fewer costs than a standard refinance. In this article, we’ll explore FHA Streamlines in depth, so you can decide if it’s right for you.
What Exactly Is an FHA Streamline Refinance?
An FHA Streamline Refinance is designed for homeowners with existing FHA-insured mortgages. It’s a simplified version of refinancing, aimed at reducing your interest rate, lowering your monthly payment, or switching from an adjustable-rate mortgage (ARM) to a fixed-rate one. No need for a full-blown application process—it’s streamlined, hence the name.
Understanding the FHA’s Logic: Why So Simple?
The FHA already insured your original loan, so the risk is squarely on their books—It’s not a new or additional risk, per se—they’ve vetted you once and stand behind it. That means no need to re-verify every detail, like income or credit from scratch; why make you retake your driver’s test just to renew your license if you’ve been accident-free. This approach rewards personal responsibility—if you’ve kept up with payments, why bog you down? Moreover, by lowering your rate or payment, the FHA actually reduces overall risk: Studies show streamline refinances cut defaults and foreclosures because borrowers face lower monthly burdens, making it easier to stay current and freeing up cash for family outings or savings.
Who Is Eligible? (And Who Might Be Left Out?)
Eligibility is straightforward, but it’s important to confirm the details.
To qualify for an FHA Streamline:
-
You must currently have an existing FHA-insured mortgage.
-
At least 210 days must have passed since your current loan closed.
-
You’ve made at least six full monthly payments on that loan.
-
Your payment history should be solid: no more than one payment 30 days late in the past 12 months, and none in the last three months.
-
The refinance must provide a “net tangible benefit,” such as reducing your principal and interest payment by at least 5% (or converting to a shorter term or fixed rate).
-
The property must be your primary residence, though some exceptions apply for investment properties under certain conditions.
Not eligible? If your loan isn’t FHA-backed, or if you’re looking to cash out equity, this product won’t fit. In those cases, we can explore other options tailored to your needs.
Why Choose an FHA Streamline? The Benefit & Advantages
In a world of rising costs—from groceries to gas—why not take advantage of an opportunity to reduce your mortgage expenses? Borrowers often choose an FHA Streamline when interest rates dip, potentially saving hundreds monthly. For instance, if rates have fallen since you bought your home, refinancing could lock in those savings without the paperwork of a standard refinance.
It’s ideal if you want to:
-
Lower your monthly payment to free up cash for family, investments, or other priorities.
-
Switch to a fixed rate for greater stability.
-
Avoid the stress of gathering supporting documentation; this program relies on your existing loan’s track record.
The FHA Streamline offers several benefits, making it more appealing than a full refinance:
-
Lower Rates and Payments: The primary benefit—reduce your interest rate and monthly costs.
-
Simplicity: Minimal hassle means less time spent on the process.
-
No Out-of-Pocket Cash Needed: Closing costs can often be rolled into the loan.
-
Preserve Your Equity: No cash-out allowed, so you maintain your current equity position.
|
| Advantage |
How it Benefits You |
Example |
| Lower Rates and Payments |
Lower Monthly Expense |
Save $2,340 annually (0.50% drop on 600K loan) |
| Simplicity |
Less Paperwork |
Complete in Minutes vs Hours |
| No Out-of-Pocket Cash |
Roll Costs into Loan |
Avoid Dipping into Savings |
| Preserve Equity |
No Cash-out |
Build wealth, like Compounding Interest |
|
|
|
|
Streamline Process Overview: Documentation & Timeline
This program simplifies traditional refinancing by reducing requirements:
What’s Typically NOT Required (The Real Time- and Money-Savers):
-
Appraisal? Usually skipped entirely, avoiding a $500–$700 fee and weeks of waiting. Why? The FHA trusts your existing loan’s value unless you’re adding a non-credit-qualifying co-borrower or the lender deems it necessary (at their discretion).
-
Credit Score/Check? No deep dive into your credit history or score requirements. Lenders might do a soft pull to confirm basics, but bad credit won’t disqualify you if your FHA payments are current (e.g., no more than one 30-day late in the past year). This is a nod to personal accountability: If you’ve handled your current mortgage well, why re-prove yourself?
-
Income Verification Docs? Forget gathering pay stubs, W-2s, tax returns, or bank statements for income proof—none of that’s needed for non-credit qualifying cases. No debt-to-income ratio calculations either, freeing you from reliving last year’s finances.
-
Asset or Liability Details? Skip listing out your full financial picture; the focus is on your mortgage track record, not your entire portfolio.
-
Full Loan Application? Instead of the exhaustive Uniform Residential Loan Application (URLA), use an abbreviated version where only occupancy (e.g., primary residence) needs confirmation—sections on borrower details, employment, assets, and liabilities are exempt.
It’s more lenient than conventional loans, making it accessible if you’ve been responsible with your current mortgage.
Does This Loan Close Quicker? (And By How Much?)
Yes, an FHA Streamline can shave off 15-25 days compared to a traditional refinance, thanks to skipped steps like appraisals and income verification. That’s like turning a month-long wait into a quick sprint—more time for what matters most!
Is the Pricing Different? Let’s Talk Dollars and Sense
-
Pricing is generally more favorable due to the program’s efficiency:
-
Upfront Mortgage Insurance Premium (MIP) is 0.01% if shortening the loan term, or 0.55% otherwise—rollable into the loan. Annual MIP applies as usual.
Compared to standard refinances, you’ll save on origination fees and avoid appraisal costs. The trade-off? No cash-out, so it’s focused on rate reduction. As rates fluctuate in 2025, this could mean significant savings over your loan’s life.
Wrapping It Up: Is This Your Next Move?
If you have an existing FHA Mortgage, and if rates dropped since the time you closed your current loan, an FHA Streamline may be a smart strategy worth considering.
If this sparks interest, reach out to Integrity Capital Mortgage. We are honored to guide you through the process and answer any questions.
|
|
|
|
|
|
|
|
|
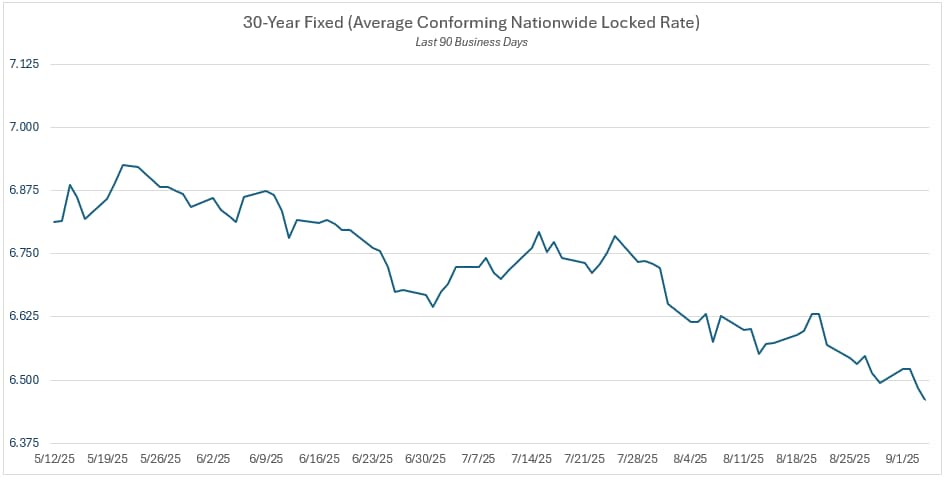
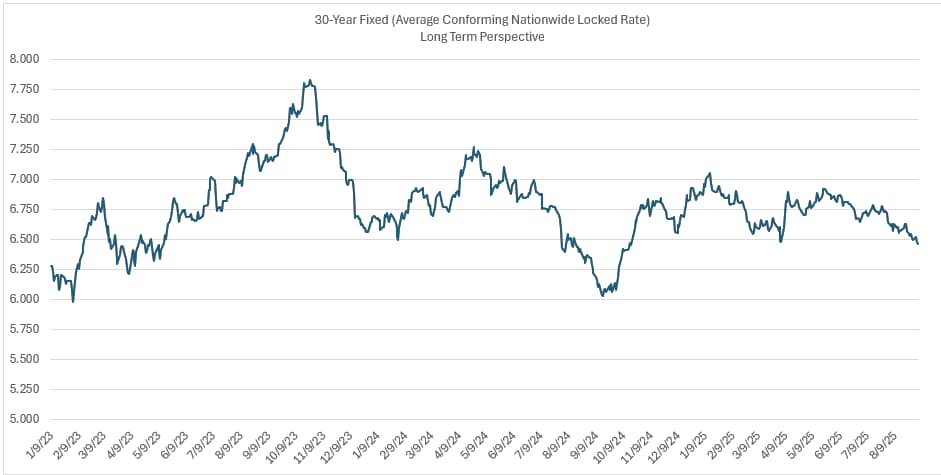
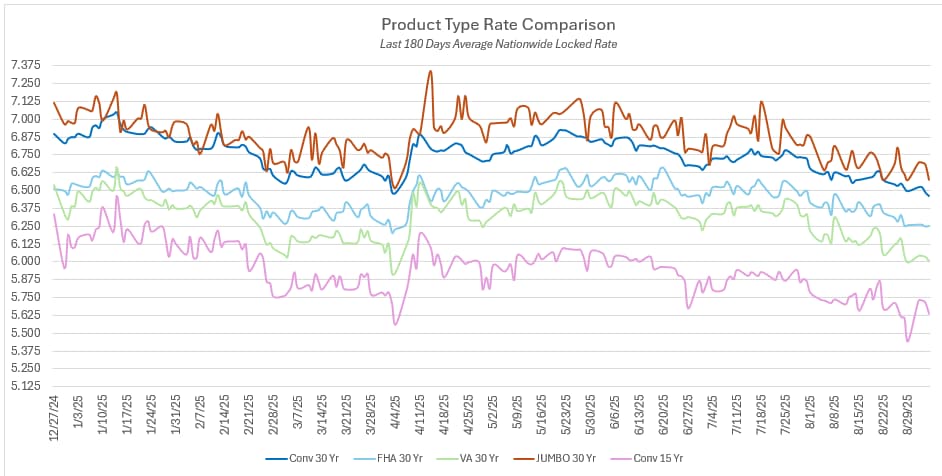
Late summer has delivered more than a change in weather — it’s delivered relief in mortgage rates. The improving trend has extended beyond a month and is improving homebuying affordability. Rate (yield) changes for specific product classes since August 1st as as follows:
-
30-Year Fixed Conventional: Decreased by 23 basis points.
-
15-Year Fixed: Dropped by 28 basis points.
-
5/6 ARM: Lowered by 18 basis points (Note: ARMs are less sensitive than fixed rate products since they are tied to shorter-term benchmarks.)
-
FHA and VA (Government-Backed Loans): Declined by 24 basis points.
Mortgages vs. Treasuries: Performance and Yield Curve Insights
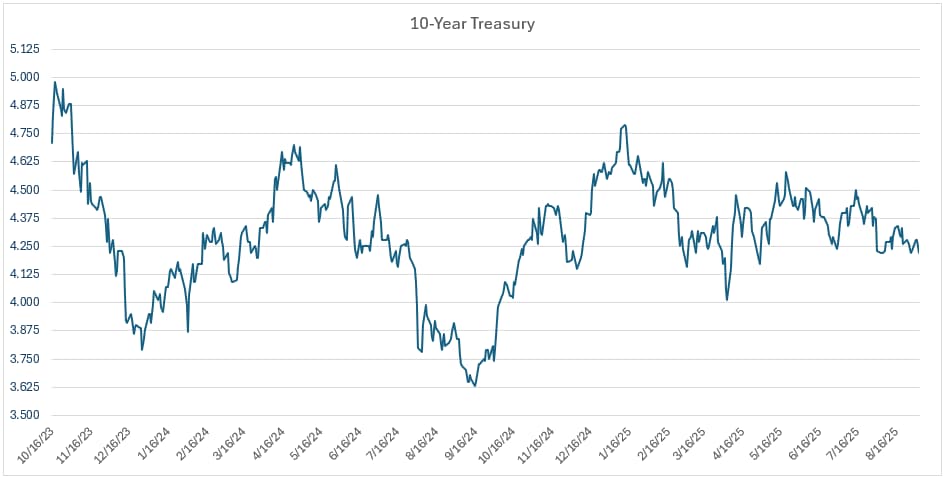
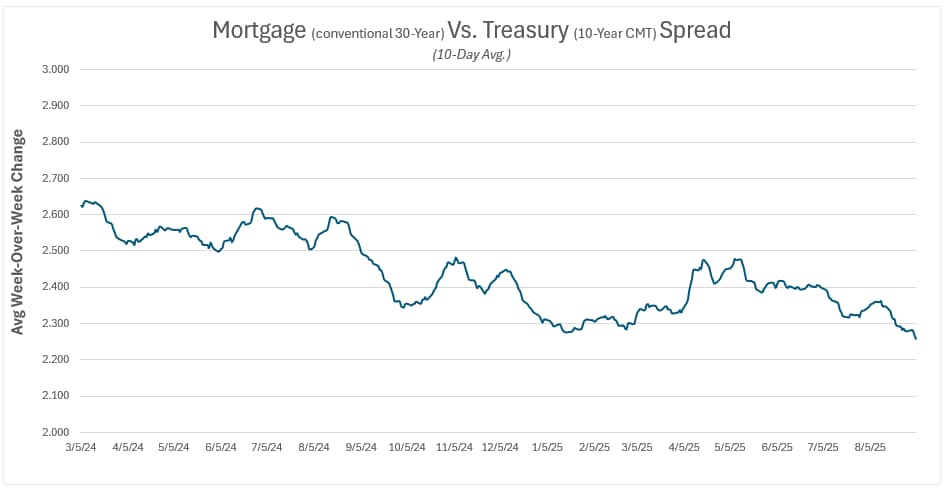
Mortgages have slightly outperformed U.S. Treasury yields, dropping a few more basis points in relative terms. The 10-year Treasury yield fell by about 21 basis points, while the 2-year yield dropped around 20 basis points. This narrowing of mortgage spreads (the premium over Treasuries) reflects growing investor confidence in mortgage-backed securities, driven by expectations of Federal Reserve rate cuts.
The yield curve, which plots Treasury yields across maturities, has steepened slightly. The spread between the 2-year and 10-year yields widened from roughly 0.45% to 0.58%. This indicates faster declines in short-term yields, signaling market expectations of near-term economic cooling without long-term distress, which supports fixed-rate mortgage performance.
The spread between the 5/6 ARM and the 30-year fixed has narrowed by about 5 basis points since early August; meaning fixed rates have performed than ARMs. This is because fixed rates are closely tied to long-term bond yields, which have dropped with cooling inflation expectations. ARMs, are pegged to the SOFR index (a short-term rate benchmark), and saw less movement due to stickier short-term rates.
Why Rates Changed: Key Drivers and News
-
Softer Employment Data: August’s jobs report added 140,000 jobs, below the expected 160,000, with unemployment rising to 4.3%. This suggests a cooling labor market, reducing inflationary pressures from wage growth and prompting markets to anticipate Fed rate cuts.
-
Declining Inflation: July’s Consumer Price Index (CPI) fell to 2.9% year-over-year, the lowest since 2021, with August data hinting at further easing. Lower inflation reduces the need for high rates to control prices, directly impacting mortgage rates.
-
Federal Reserve Signals: Fed Chair Powell’s August Jackson Hole speech indicated a potential rate cut in September, boosting bond prices and lowering yields. This anticipation contributed to the downward pressure on rates.
-
Global and Market Dynamics: Geopolitical uncertainties and stock market volatility drove investors toward safer assets like Treasuries, indirectly supporting mortgage rates.
|
|
|
|
|
|
|
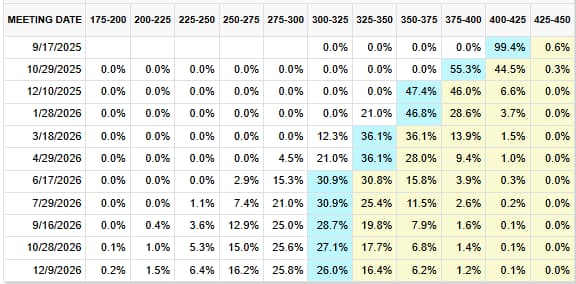
The next Federal Open Market Committee (FOMC) meeting is set for September 17th, and markets are buzzing with anticipation. Extrapolating from where fed funds futures are trading, there’s a staggering 99.4% probability of a 25 basis point cut in the federal funds rate, bringing it down from the current 4.25%-4.50% range to 4.00%-4.25%. This is a 10 percentage point increase from what I reported in the prior newsletter.
What’s Driving the Shift in Rate Cut Probabilities?
-
Recent economic data has painted a picture of a cooling labor market and easing inflation, signaling to the Fed that it’s time to ease up on the brakes. Key factors include:
-
Labor Market Softening: The latest jobs data shows a slowdown in hiring, with job creation dipping below expectations in recent months. Unemployment has ticked up slightly, and wage growth is moderating, reducing fears of wage-driven inflation.
-
Inflation Trends: Core inflation has been stubbornly sticky but is showing signs of retreat, partly due to resolved supply chain issues and lower energy prices. However, ongoing tariffs have kept some upward pressure on prices, making the Fed cautious.
-
Other Indicators: Strong consumer spending and GDP growth earlier in the year had markets doubting cuts, but recent revisions (like downward adjustments to Q2 GDP) have flipped the script. Fed Chair Jerome Powell’s recent comments at Jackson Hole hinted at impending cuts, boosting market sentiment.
Market Reactions: What If the Fed Cuts… or Doesn’t?
With such a high probability baked in, the market’s reaction will hinge on whether the Fed meets, exceeds, or defies expectations. Part of the equation is also the Fed’s commentary on future fed cuts. Here’s a straightforward look:
-
If the Fed Cuts by 25 bp (as Priced In): This would likely be met with a collective sigh of relief and mild positivity. Stocks could edge up 0.5-1% initially, as lower rates boost borrowing and investment. Bond yields might dip slightly, helping mortgage rates ease further (potentially by 0.10-0.25% over time). The dollar could weaken a bit, aiding exports.
-
If the Fed Holds Steady (No Cut): This would be a surprise, potentially sparking a sharp sell-off. Stocks might drop 1-2% or more, as investors recalibrate for higher-for-longer rates. Yields could spike, pushing mortgage rates up and hurting homebuyers.
Of course, a bigger 50 bp cut (very low probability) would ignite a rally, with stocks jumping 2%+ and mortgage rates falling faster. Keep in mind, markets hate surprises, so the Fed often telegraphs moves to avoid volatility.
Additional Rate Cuts on the Horizon?
Beyond September, the FOMC has two more meetings scheduled this year: October 29th and December 10th. The market is pricing-in 75-100 bp of additional cuts by year-end, translating to three more 25 bp reductions (including September). However, this isn’t “scheduled” per se—the Fed doesn’t pre-commit; rather it’s data-dependent.
|
|
|
Next FOMC Meeting: Wednesday, September 17
Current Fed Funds Rate Range: 4.25% – 4.50%
|
|
|
Fed Funds Probabilities Table
How to Interpret: The top row lists fed fund rate ranges. The left-most column lists upcoming dates for FOMC rate cut decisions. The values represent the probability of the fed funds rate lying in that range. Each row will sum to 100%. The probabilities are market-based and derived from the prices where futures contracts are trading.
|
 |
|
|
 |
|
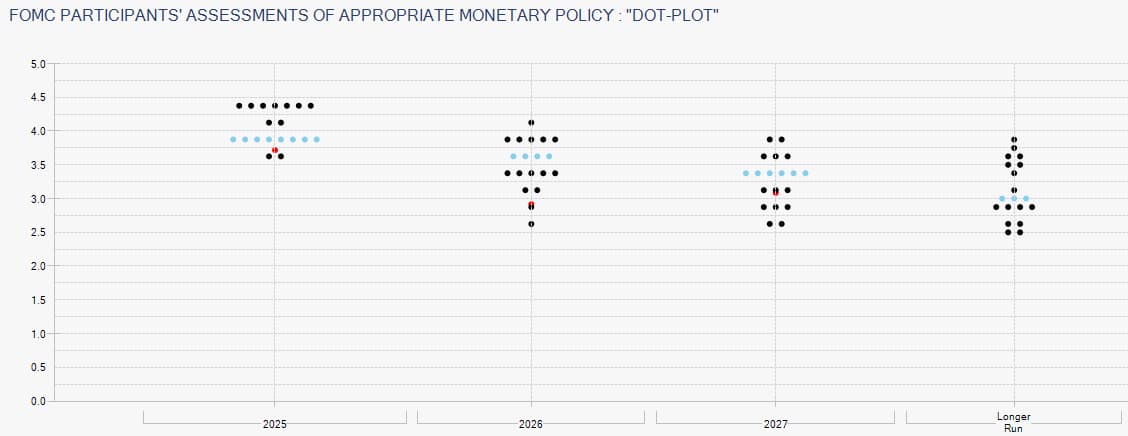
How to Read the Fed’s Dot Plot (chart below)
● Each dot represents one FOMC member’s forecast.
● There are 19 participants in the dot plot:
-
▪︎ 7 Fed Board Governors (nominated by the President and confirmed by the Senate
-
▪︎ 12 Regional Fed Bank Presidents
● The red dot shows the market’s forecast, based on the price where futures are trading.
● The blue dots represent the median forecast.
● The greater the dispersion in the dots, the less consensus between the participants.
Usefulness for Borrowers: Provides an educated indication of where the Fed Funds rate may be in future years.
|
|
|
|
|
|
|
|
Question: Why should I stay abreast of upcoming economic news?
Answer: Financial markets react to disparities between expected versus actual economic data. On days where highly anticipated economic data is released there is a greater likelihood of heightened volatility (risk). This is particularly relevant if you are locking in a rate.
|
|
|
|
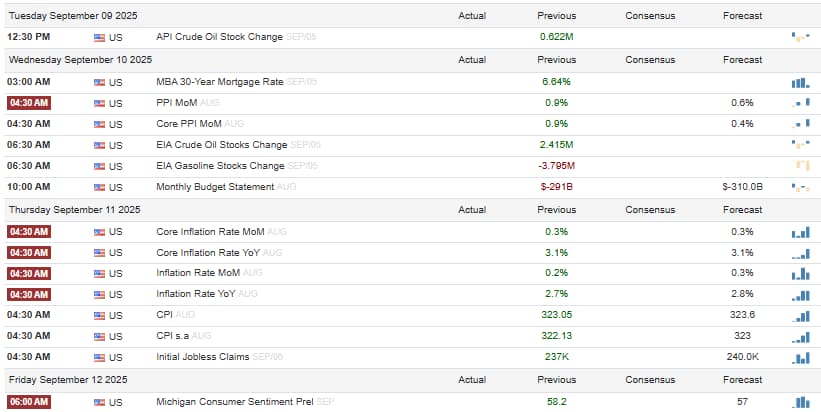
Here’s a rundown of this week’s key economic data being released — what’s coming & why it matters (the full calendar is at the end of this section):
-
What: Producer Price Index (PPI). PPI measures changes in selling prices received by domestic producers for goods and services. It’s an early inflation gauge (leading indicator) at the wholesale level—rising PPI can signal cost pressures passed through to consumers (think raw materials to finished products). Core PPI excludes volatile food and energy for a clearer trend.
-
When: Wednesday, September 9, at 5:30 AM PST
-
Volatility Risk: 🔥🔥🔥 (Moderate)
-
Market’s Expectation: Analysts anticipate a 0.1% month-over-month increase in headline PPI for August, matching the prior month’s 0.1%. On a year-over-year basis, it’s expected to come in at 1.8%, down from the previous 2.2%. For core PPI (excluding food and energy), the forecast is a 0.2% month-over-month rise (up from the prior 0.0%) and 2.5% year-over-year (slightly higher than the previous 2.4%).
-
What to Watch For: Pay attention to components like energy and trade services. If the figures come in hotter than expected, it could heighten inflation concerns; cooler data might ease inflation concerns.
-
Significance for Mortgage Rates: This release can set the tone for inflation trends, which directly impact bond markets. Hotter PPI numbers might drive up Treasury yields, potentially increasing mortgage rates by 0.10-0.20% as investors worry about persistent price pressures. Conversely, softer readings could lower yields and rates, signaling room for the Fed to cut more aggressively—good news for borrowers looking to lock in lower payments.
|
|
|
-
What: Consumer Price Index (CPI). CPI measures price changes in a basket of goods and services typical for urban households, including food, housing, and transportation. Core CPI omits food and energy for a less volatile picture. It’s a cornerstone for Fed decisions, as it reflects cost-of-living pressures.
-
When: Thursday, September 11, at 5:30 AM PST
-
Volatility Risk: 🔥🔥🔥🔥 (High)
-
Market’s Expectation: For August, experts predict a 0.2% month-over-month rise in headline CPI, consistent with the prior 0.2%. Year-over-year, it’s forecasted at 2.6%, a drop from the previous 2.9%. Core CPI is expected to increase 0.2% month-over-month (matching the prior) and hold steady at 3.2% year-over-year (same as before).
-
What to Watch For: Focus on shelter costs and energy prices—these often drive surprises. A hotter report could stoke Fed caution, while softer figures might accelerate easing bets.
-
Significance for Mortgage Rates: As the Fed’s key inflation metric, CPI has outsized influence. If it exceeds expectations, mortgage rates could climb 0.20-0.50% or more amid rising yields, making loans costlier. On the flip side, below-consensus data might drop rates, as markets price in deeper Fed cuts.
|
|
|
-
What: Initial Jobless Claims. This weekly report counts new filings for unemployment benefits. It provides a real-time snapshot of labor market health—fewer claims suggest strong hiring and low layoffs, while increases point to softening conditions.
-
When: Thursday, September 11, at 5:30 AM PST
-
Volatility Risk: 🔥🔥🔥 (Moderate)
-
Market’s Expectation: For the week ending September 6, the consensus is around 230,000 new claims, slightly down from the prior week’s figure (which was approximately 231,000).
-
What to Watch For: Monitor the four-week moving average for broader trends. A spike could indicate economic weakness, while a drop reinforces stability.
-
Significance for Mortgage Rates: Jobless claims reflect employment trends, one of the Fed’s dual-mandates. Higher-than-expected claims might lower rates by raising recession fears and cut probabilities, benefiting refinancers. Lower claims could firm rates up, as a solid job market reduces urgency for easing.
|
|
|
-
What: Consumer Sentiment (Preliminary). This survey assesses how consumers view the economy, their finances, and future buying plans. High sentiment boosts spending (a GDP driver); low levels signal caution, potentially slowing growth.
-
When: Friday, September 12, at 7:00 AM PST
-
Volatility Risk: 🔥🔥 (Low-Moderate)
-
Market’s Expectation: The preliminary reading for September is expected to be around 68.0, a modest improvement from the prior month’s 67.9.
-
What to Watch For: The inflation expectations sub-index is key—if it rises, it could fan pricing concerns; a decline might calm concerns.
-
Significance for Mortgage Rates: Sentiment influences consumer behavior, which ties into growth and inflation. A weaker-than-expected print could ease rates by suggesting softer demand ahead, opening the door for Fed support. Stronger sentiment might hold rates steady or higher, reflecting economic resilience.
|
|
|
|
|
|
|
Housing Corner
|
|
The housing market is in the midst of a significant shift, creating opportunities for homebuyers, and challenges for home sellers. The intention of this section is to provide some clarity on the dynamic housing market, so you are better prepared to adjust strategies as needed.
Inventory Levels: A Shift Toward Balance
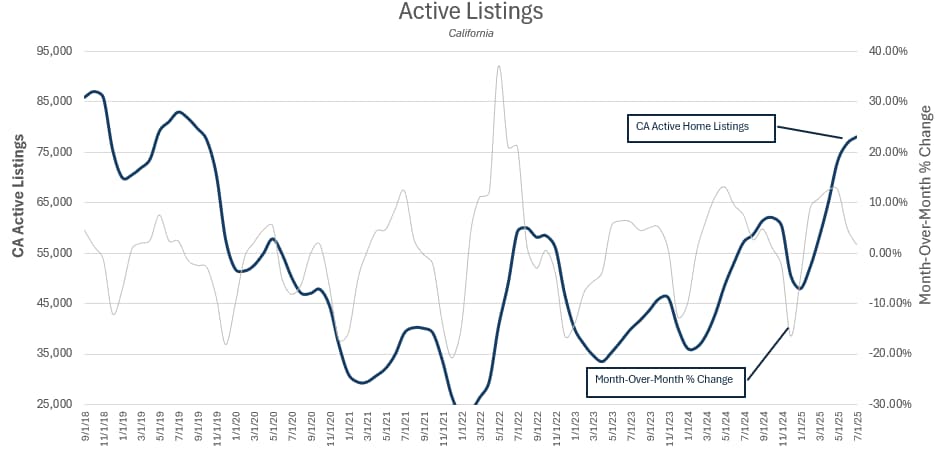
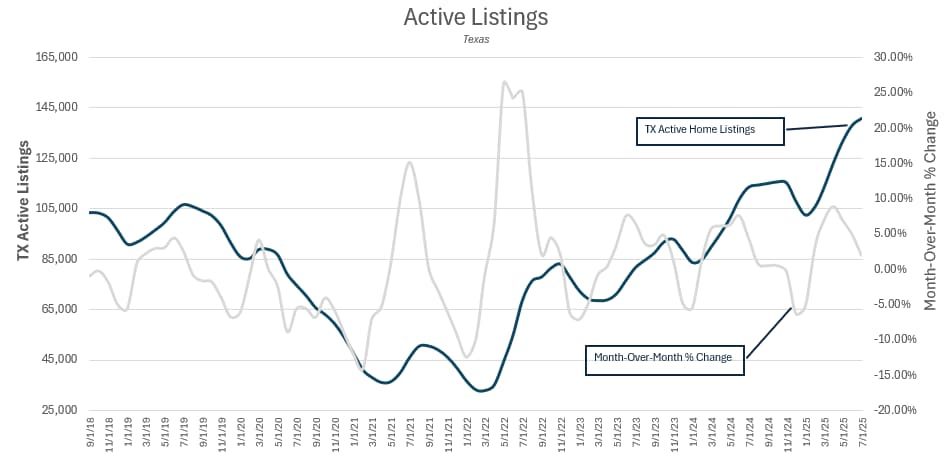
Inventory, or the number of homes available for sale, has been a critical factor in both CA and TX. After years of tight supply, 2025 is showing signs of improvement as more homes hit the market.
-
California: In July 2025, active listings totaled 117,079, up 15.6% on a year-over-year basis. This is a significant increase from the lows of 2021-2022 (under 50,000 homes), though still below pre-pandemic norms of around 150,000. The Unsold Inventory Index (UII), which measures how long it would take to sell all homes at the current sales pace, reached 3.7 months in July, up from 2.9 months in July 2024. This trend, accelerating since mid-2023, reflects a gradual shift toward a more balanced market.
-
Texas: Inventory rose 15.4% year-over-year to 186,084 homes in July 2025, with months of supply reaching 4.8 in Q1 2025, up from 3.7 in 2024. Over the decade, inventory was tightest in 2021 (under 2 months’ supply), but the current level approaches a balanced market (4-6 months). Texas has benefited from new construction, particularly in suburban areas, though oversupply in some metros like Dallas is now moderating prices.
Contributing Factors: The “lock-in effect” from homeowners with low-rate mortgages (often below 4%) has kept inventory constrained, but improving rates and life changes (e.g., job relocations) are encouraging more listings. California’s inventory growth is slower due to regulatory barriers and high land costs, while Texas’s faster construction pace has boosted supply, especially in affordable markets like San Antonio and Houston.
|
 |
 |
|
Pace of Home Sales: A Slower but Stable Market
The pace of home sales reflects market activity and buyer enthusiasm, which has slowed in both CA and TX due to affordability challenges.
● California: Home sales in July 2025 totaled 25,324, down 2.6% year-over-year from 26,004 in July 2024. Annual sales are projected to reach around 300,000 in 2025, a recovery from the 2023 low of 257,900 but below the 2021 peak of over 400,000. The trend shows a post-2020 boom followed by a slowdown as rates rose, with 2024-2025 stabilizing at lower volumes.
● Texas: Sales rose slightly by 0.2% year-over-year to 29,352 in July 2025. Annual sales are expected to be around 350,000, down from the 2021 high of over 400,000 but stable compared to 2024. The decade saw strong growth driven by migration into the state, peaking in 2021, with recent years tempered by higher rates.
Contributing Factors: Affordability remains the primary barrier, with monthly payments for a median-priced home up significantly since 2020 due to higher rates and prices. In California, a persistent housing shortage keeps competition comparatively high despite slower sales. In Texas, increased supply and more affordable prices have supported slight sales growth, though rates continue to deter some buyers.
Days on Market: More Time to Decide
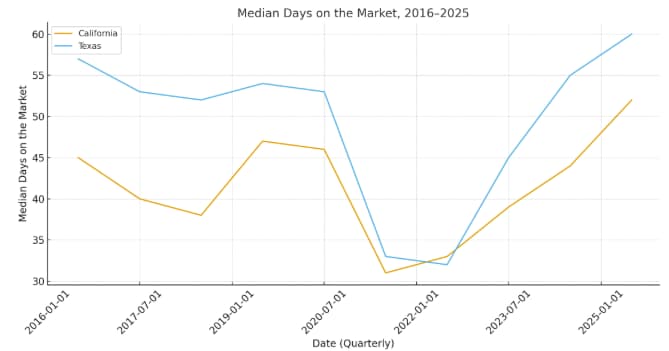
Days on market (DOM) indicates how long homes take to sell, reflecting buyer urgency and market competitiveness.
● California: The median DOM in July 2025 was 44 days, up 14 days year-over-year from 30 days in July 2024. Over the decade, DOM averaged 40-50 days, dropping to a low of 30 days in 2021-2022 during the buying frenzy. The recent increase suggests buyers have more time to evaluate options.
● Texas: Median DOM reached 58 days in July 2025, up 12 days year-over-year. The decade-long trend shows DOM at 60-65 days in the mid-2010s, dipping to 40-45 days in 2021, and now climbing back toward 60 days as the market cools.
Contributing Factors: Rising inventory reduces competitive pressure from other homebuyers. As the homes for sale sit on the market longer, sellers become more amicable to offering a price reduction or seller concession. In both states, the percentage of homes selling above list price has declined (34.9% in CA, 12.5% in TX), signaling a less frenzied market.
|
 |
|
Home Price Trends
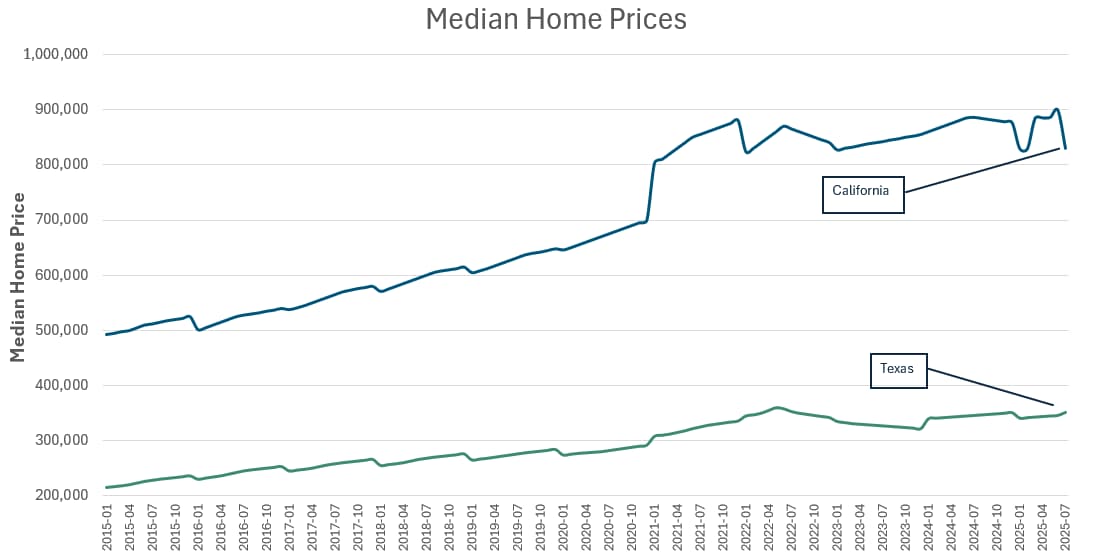
As we all know, home prices in California and Texas have seen significant growth over the past decade, driven by strong demand, economic expansion, and low interest rates through the 2010s and early 2020s. Prices peaked around mid-2022 during the post-pandemic boom. But the winds are changing and during the last couple months home prices have been flat to slightly declining.
● California: In July 2025, the median home price was $830,200, down 0.83% year-over-year from $837,150 in July 2024. This continues a trend of slight declines for three consecutive months, reflecting a cooling market. Over the past 10 years, prices rose from around $493,000 in January 2015 to a peak of $900,000 in May 2022, driven by high demand in coastal areas, tech wealth, and limited supply. Since 2022, price growth has slowed, with monthly fluctuations showing seasonal dips (e.g., -1.7% from June to July 2025).
● Texas: The median home price in July 2025 was $351,600, down 0.41% year-over-year from $353,050. Prices have grown from about $215,000 in January 2015, fueled by population growth, job opportunities in cities like Austin and Houston, and migration into the state. The peak was $360,000 in June 2022, followed by a 2.9% decline in 2023 and flat growth in 2024-2025. Metro areas like Austin have seen sharper corrections (e.g., -3% YoY in May 2025), while others like San Antonio remain stable.
Contributing Factors: Economic uncertainty, including inflation and potential job market shifts, has encouraged more sellers to list, easing upward pressure on prices. In California, restrictive zoning and high construction costs limit supply, keeping prices high despite declines. In Texas, rapid suburban construction has increased supply, particularly in Dallas and Austin, contributing to price stabilization.
|
 |
|
How Should Potential Homebuyers Interpret This News?
The current market offers opportunities for buyers ‒ Finally! Rising inventory and longer days on market provide more choices and negotiation leverage, with 30.1% of California homes and 38.1% of Texas homes seeing price drops in July 2025. Texas is shifting toward a buyer’s market, while California remains moderately competitive but less frenzied. This environment allows you to shop carefully and negotiate better terms.
|
|
|
|
|
|
|