Mortgage Matters With Integrity
|
|
|
|
Written & Prepared by: Brian Tilton
|
|
|
|
|
|
|
|
Understanding Adjustable Rate Mortgages (ARMs):
A Comprehensive Guide
|
|
|
|
Adjustable Rate Mortgages (ARMs) often carry a stigma, largely due to their comparative complexity and a lack of understanding among borrowers. While ARMs can seem daunting, they can be a smarter choice than fixed-rate mortgages in many cases, depending on a borrower’s specific circumstances, current market conditions, and expectations for future interest rates. By gaining a clear understanding of ARMs, borrowers can confidently evaluate whether this mortgage product aligns with their financial goals, potentially unlocking significant savings and flexibility.
Introduction to ARMs
An Adjustable Rate Mortgage (ARM) is a home loan where the interest rate is fixed for an initial period and then adjusts periodically based on market conditions. Unlike fixed-rate mortgages, which maintain a constant rate for the entire loan term (typically 15 or 30 years), ARMs offer flexibility and potential savings, during the “fixed period” years. The trade-off is uncertainty of future payments after the fixed period, which can rise or fall depending on economic trends.
ARMs are often appealing to borrowers who:
- Plan to sell or refinance their home within several years.
- Expect interest rates to remain stable or decline.
- Need lower initial payments to fit their budget.
However, the potential for rate increases makes ARMs riskier for homeowners who intend to hold the loan until maturity. Let’s do a deep-dive analysis into the details of how ARMs work and explore their key features.
Types of ARMs: 5/6, 7/6, 10/6, and More
ARM types are identified by two numbers, such as 5/6, 7/6, or 10/6, which describe part of their structure:
- First Number: The duration of the initial fixed-rate period in years.
- Second Number: The frequency of rate adjustments after the fixed period, typically in months or years.
The choice of which ARM variation best fits your needs depends on your financial goals and how long you plan to stay in your home. A 5/6 ARM offers a shorter fixed period with potentially lower initial rates, while a 10/6 ARM provides more stability before adjustments begin. The 6-month adjustment frequency (e.g., 5/6) means more frequent changes compared to annual adjustments (e.g., 5/1), which can affect payment predictability after the fixed period ends.
Structure of ARMs: Index, Margin, and Caps
ARMs are built on three core components that determine how the interest rate is calculated and adjusted after the fixed period:
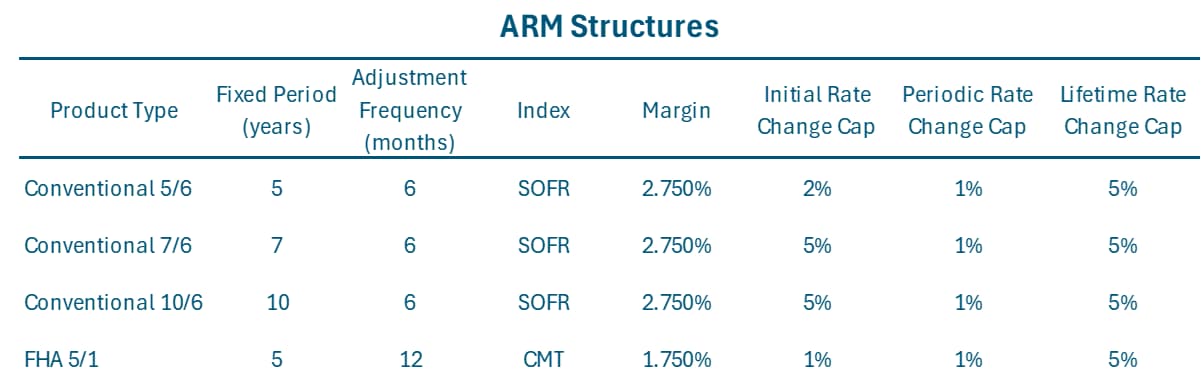
- Index: A benchmark interest rate index that fluctuates based on market conditions. While the underlying index changes daily, a loan’s rate will only adjust after the fixed period and only at each adjustment frequency (every six months for Conventional loan and every 12 months for an FHA loan). Common indices include:
- Secured Overnight Financing Rate (SOFR): Standard for conventional products. Replaced LIBOR in 2020 as a standard for conventional ARMs.
- 1-Year Constant-Maturity Treasury (CMT): Tied to U.S. Treasury securities. This is the standard for FHA ARMs.
- Cost of Funds Index (COFI): Based on savings institutions’ borrowing costs. This is less widely used.
- Margin: A fixed percentage added to the index to set the future interest rate after the fixed period. For example, if the SOFR index is 3% and the margin is 2.5%, the ARM rate will adjust to is 5.5%. Margins remain constant for the life of the loan.
- Caps: Limits how much the rate can increase or decrease at each adjustment, thereby limiting borrower and investor risk:
- Initial Cap: Limits the rate change at the first adjustment.
- Periodic Cap: Limits rate changes on each subsequent adjustment period.
- Lifetime Cap: Caps the total rate change over the life of the loan.
- Floor: Establishes the minimum rate over the life of the loan. The floor is generally equal to the margin.
In summary, after an ARM’s initial fixed period, the rate will adjust to the “fully-indexed rate”, which is the index value plus the margin, subject to the cap limits.
A table describing the ARM structures for the primary product types is below.
|
 |
|
|
|
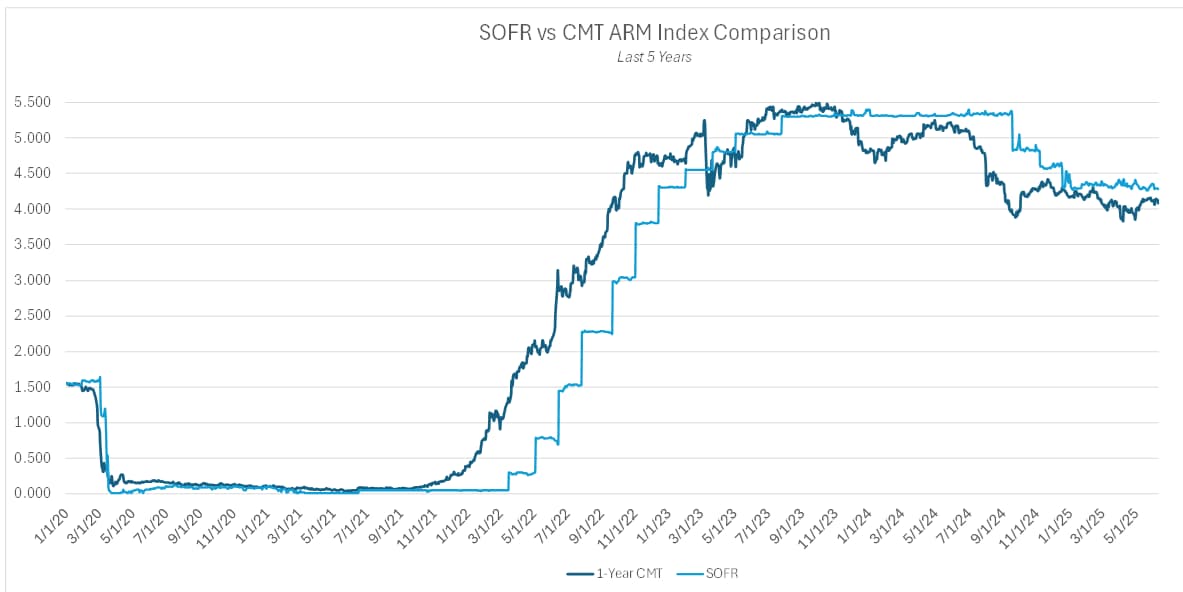
A historical lookback on SOFR and CMT rates is shown in the diagram below. While both indices move in the same direction, SOFR tends to be slower to react. This could be good or bad for borrowers depending on which direction rates are moving. If rates are increasing, you want the index to be slow to change; but if rates are dropping you want the index to change ASAP.
|
 |
|
Examples of ARM Rate Calculation
Suppose you have a 5/6 ARM with:
- Initial rate: 5.25%
- Margin: 2.75%
- Caps: 2% initial, 1% periodic, 5% lifetime
Let’s assume that after the five-year fixed period, SOFR is at 4.0%. The new fully-indexed rate will be 4.0% + 2.75% = 6.75%. The change between the current rate (5.25%) and the new rate (6.75%) falls below the 2% cap. Therefore, the rate will adjust to 6.75%.
Alternatively, if after 5 years, SOFR rises to 5.0%, the new fully-indexed rate is 5.0% + 2.75% = 7.75%. However, since 7.75% – 5.25% = 2.50%, which is greater than the 2% initial cap, the new rate will be capped at 7.25%; not 7.75%. The lifetime cap ensures the rate never exceeds 10.25% (5.25% + 5%).
When ARMs Make Financial Sense
ARMs can be a strategic choice in specific scenarios, but they require careful planning. Here’s when they might work for you:
- Short-Term Ownership: If you plan to sell or refinance within the fixed period (e.g., 5-10 years), you can benefit from the lower initial rate without facing a rate adjustment.
- Expectation of Falling Rates: If you anticipate lower interest rates in the future, an ARM could adjust to a lower rate, saving money compared to a fixed-rate mortgage.
- Lower Initial Payments: ARMs’ lower introductory rates reduce early payments, helping borrowers with tight budgets or those prioritizing other financial goals.
- Financial Flexibility: If you can afford potential payment increases, an ARM’s initial savings might outweigh future risks.
Comparing ARMs to Fixed-Rate Mortgages
The trade-off between ARMs and fixed rate mortgages is essentially lower rates versus higher uncertainty. More specifically, during the initial fixed period, and possibly beyond, rates are generally lower, and therefore the payment is lower. However, as discussed earlier, after the initial fixed period, the loan’s rate will adjust to the fully-indexed rate, and depending on where the market is at that point in time, it could result in the rate adjusting higher, causing an increase in the payment. This uncertainty creates risk for borrowers who intend to keep the loan beyond the fixed period. i
When deciding between an ARM and a fixed-rate mortgage, a recommended strategy is to evaluate the cumulative ARM vs fixed-rate interest savings during the fixed period, and ask yourself if this amount justifies the future uncertainty. Additionally looking at the “optimal” time in years to refinance, based where the market is expecting future rates to be is a useful calculation. Moreover, evaluating your exposure at the worst-case scenario provides an indication of the maximum downside exposure a borrower faces. Integrity Capital Mortgage has proprietary models that calculate all of these statistics, and more. We are happy to evaluate your specific scenario, without any obligation.
Spreads (differences) Between ARM and Fixed Rates
Are ARMs rates always more favorable than fixed rates? No, the comparative advantage or disadvantage of ARMs vs fixed rates fluctuates substantially depending on economic conditions. To understand why, we need to discuss the distinction between short-term and long-term interest rates:
- ARM Rates and Short-Term Indexes: As discussed earlier, ARMs are tied to short-term interest rate indexes, such as the Secured Overnight Financing Rate (SOFR) and the 1-Year Constand Maturity Treasury (CMT). These indexes reflect the cost of borrowing money in the short term—think months or a year. Because short-term rates are influenced by immediate economic conditions, like Federal Reserve policies or market liquidity, ARM rates can fluctuate frequently. For example, if the Fed raises its benchmark rate to cool inflation, short-term indexes like SOFR often rise, pushing ARM rates up.
- 30-Year Fixed Rates and Long-Term Rates: In contrast, 30-year fixed-rate mortgages are pegged to long-term interest rates, often tied to the 10-year U.S. Treasury note. These rates reflect market expectations for economic conditions over decades, including GDP growth, inflation, and stability. Because they’re locked in for 30 years, fixed rates are generally higher than initial ARM rates to account for the lender’s long-term risk and uncertainty about the future.
The spread between ARM and fixed rates exists because short-term and long-term rates respond differently to economic signals. When short-term rates are low (say, during a recession), ARMs often start with lower rates than fixed mortgages, making them attractive. But when short-term rates rise, ARMs can adjust upward, sometimes surpassing fixed rates.
The Yield Curve: A Roadmap for ARM vs Fixed Rates Spreads
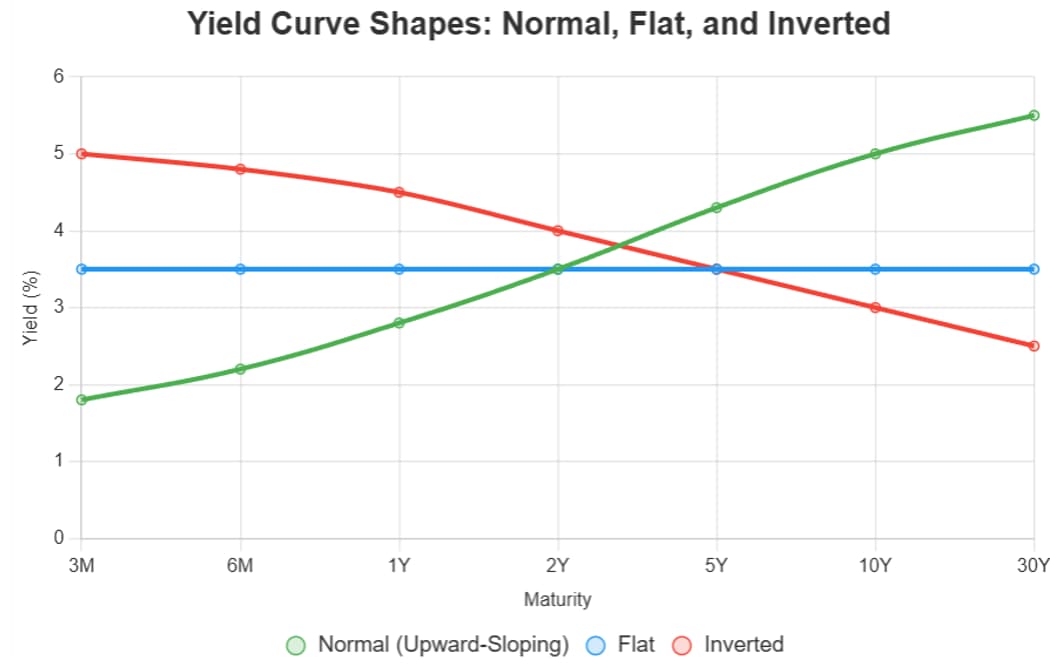
The yield curve is a powerful tool for understanding why ARM and fixed rates differ. It’s a graph plotting interest rates (yields) against the time to maturity for U.S. Treasury securities, from short-term (like 3-month T-bills) to long-term (like 30-year bonds). The shape of the yield curve tells us how the market views the future economy and inflation expectations, and it directly impacts mortgage rates.
- Normal (Upward-Sloping) Yield Curve: In a healthy economy, the yield curve slopes upward, meaning long-term rates are higher than short-term rates. Why? Investors expect higher returns for tying up their money longer, as there’s more uncertainty over time (e.g., inflation or economic shifts). In this scenario, 30-year fixed mortgage rates are typically higher than initial ARM rates, creating a wider spread. For borrowers, this makes ARMs appealing if you plan to sell or refinance before the rate adjusts.
- Flat Yield Curve: When short-term and long-term rates are close, the yield curve flattens. This often happens when the economy is in transition—say, the Fed is raising short-term rates to curb inflation, but long-term rates stay steady due to cautious growth expectations. Here, the spread between ARM and fixed rates narrows, making fixed rates more competitive if you value stability.
- Inverted Yield Curve: In rare cases, short-term rates exceed long-term rates, signaling investor concerns about a potential recession. An inverted curve can shrink or even reverse the ARM-fixed spread, where initial ARM rates might be higher than fixed rates. This scenario warns borrowers that ARM rates could climb further after adjustments. It is noted that between 2023 and early 2025 the yield curve was inverted and therefore it was not advantageous to select an ARM. However, during the last couple months conditions have changed,
A hypothetical example of each of these curves is presented below.
|
 |
|
Recap:
Before choosing an ARM, consider these factors:
- Understand the Terms: Review the index, margin, and caps. Compare lenders as their rates vary considerably. Select a lender that is an advocate for your best interest.
- Refinancing Options: Plan for refinancing by the end of the fixed period if rates rise. Depending on where rates are after the fixed period, it will be beneficial to delay refinancing, but its prudent to assume you will.
- Economic Environment: Monitor inflation, Federal Reserve policies, and economic growth, which influence rates (Morningstar).
- Time Horizon: As a general rule, ARMs are best suited for short-term plans (e.g., 5-10 years, depending on the fixed period selected). For borrowers who intend to keep a mortgage until maturity a fixed-rate has reduced risk and may be more suitable.
Conclusion
Adjustable Rate Mortgages offer a compelling option for borrowers seeking lower initial payments, particularly those with short-term ownership plans, plans to refinance, or confidence in falling rates. However, their variable nature requires careful consideration of risks, including potential rate hikes and payment uncertainty if held beyond the fixed period. By understanding ARMs’ structure, comparing them to fixed-rate mortgages, and aligning your choice with your financial goals, you can make a decision that suits your needs.
We realize there is a lot of information contained here and it might be overwhelming. Integrity Capital Mortgage is happy to assist with answering any questions you may have, regardless of whether you select us as your lender or you go with an alternative lender. Moreover we are happy to run the numbers through our proprietary model to quantify whether an ARMs’ savings justifies the higher future uncertainty. With the right strategy, an ARM could be a powerful tool to save you thousands of dollars in interest and offer you lower payments to achieve your homeownership dreams.
|
|
|
|
|
|
|
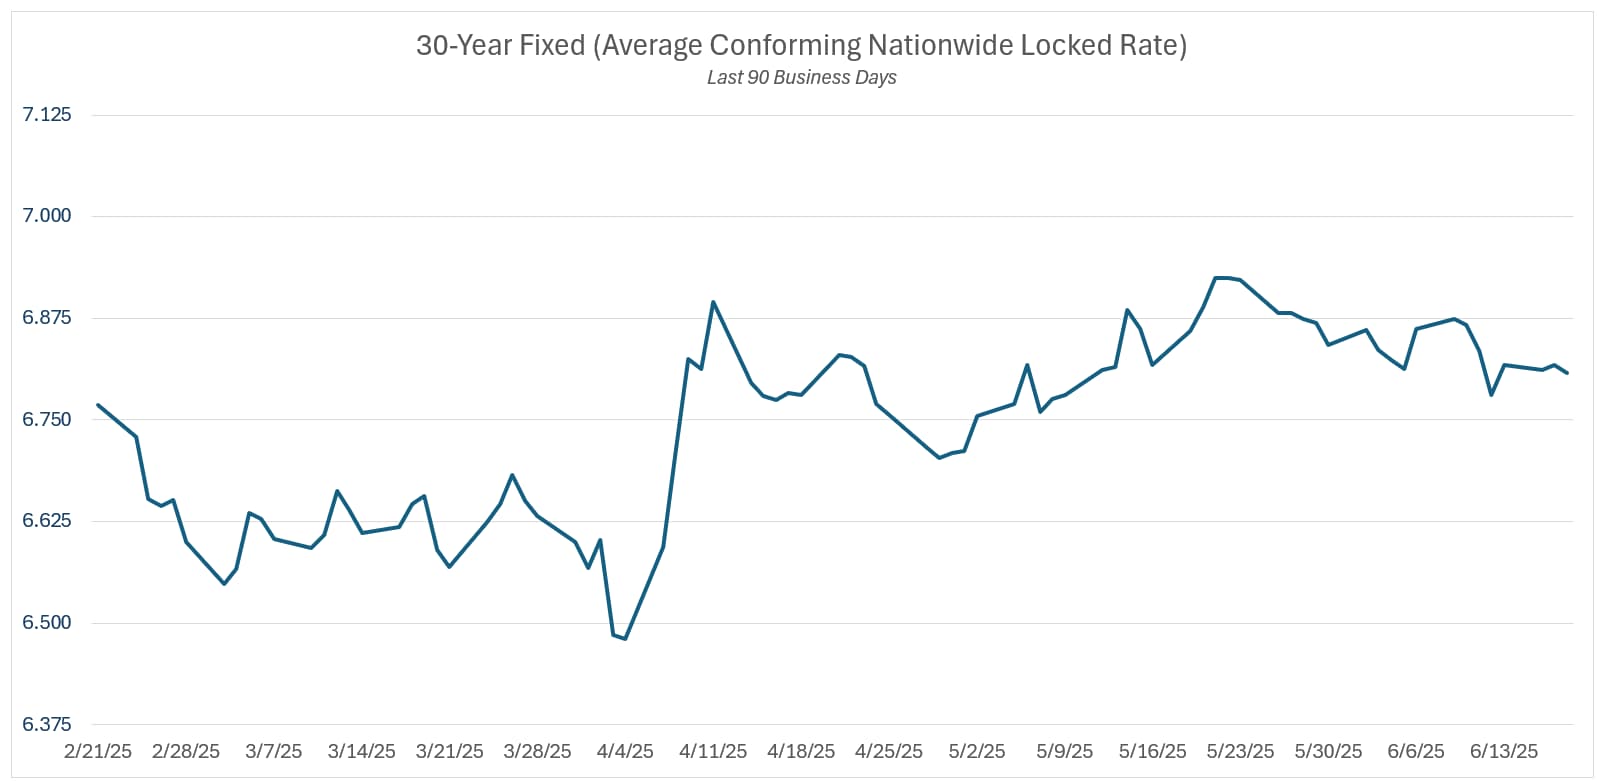
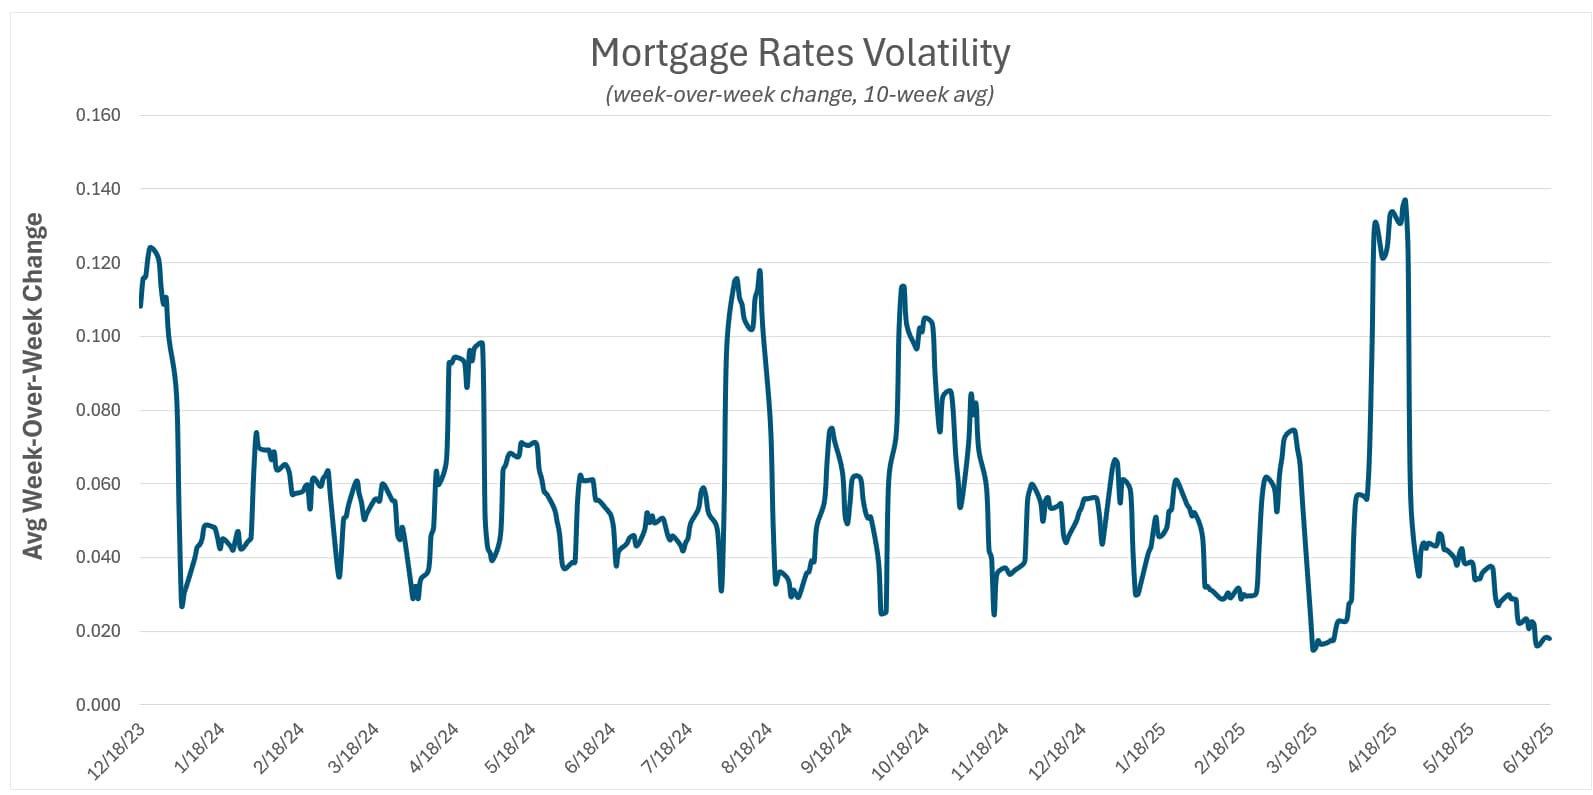
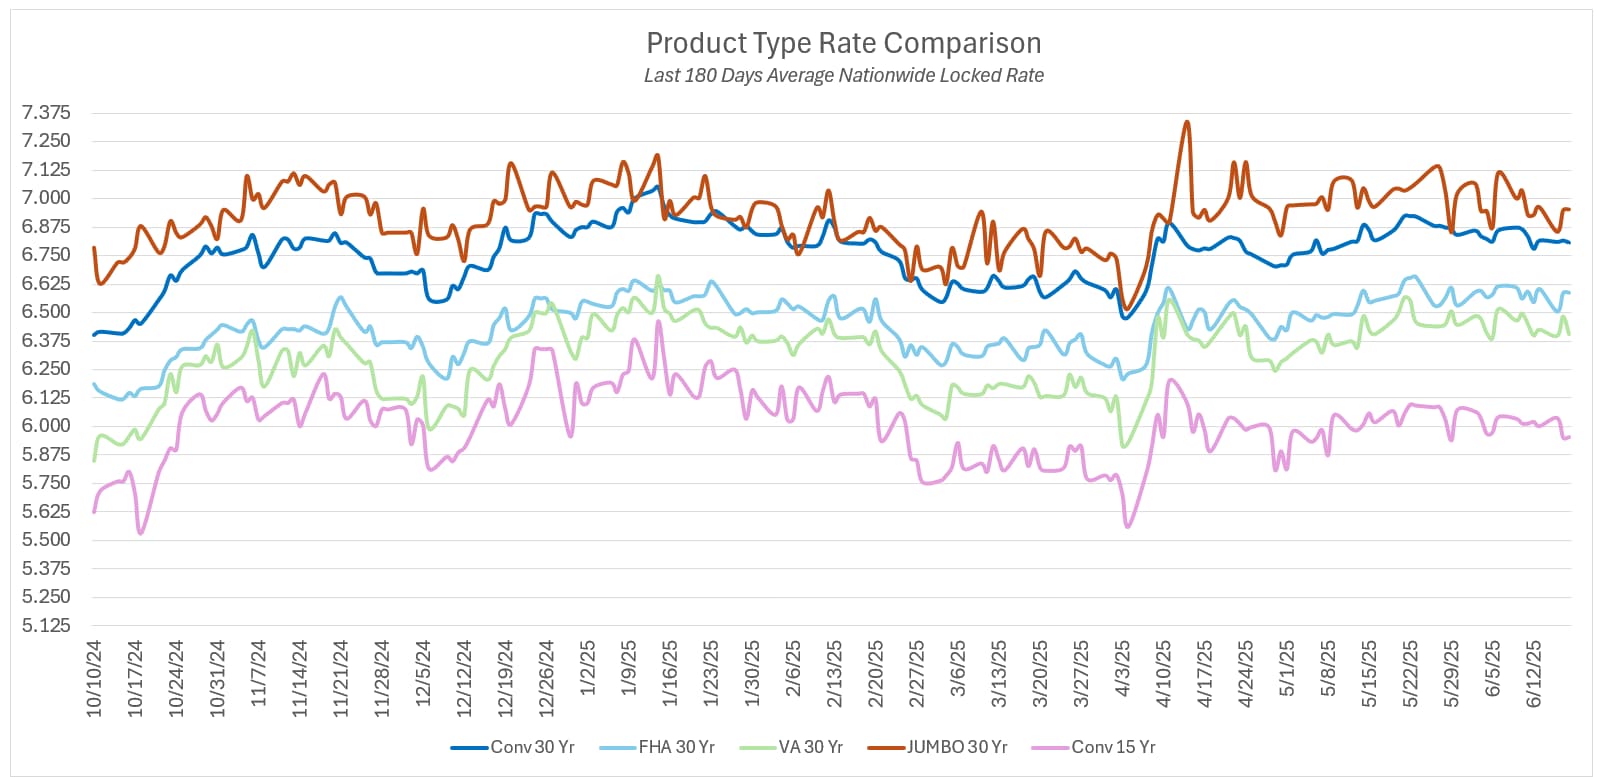
Mortgage rates started the week with a welcome dip in rates giving borrowers a brief window of opportunity to lock-in, but by the week’s end, rates edged back up. Here’s how rates moved across popular loan categories last week, measured in basis points (bps, where 100 bps = 1%):
-
30-Year Fixed Conventional: +2 bps
-
15-Year Fixed Conventional: +1 bps
-
30-Year Fixed FHA: +3 bps
-
30-Year Fixed VA: +2.5 bps
-
5/1 ARM: +4 bps
Early-Week Dip: A Glimmer of Hope
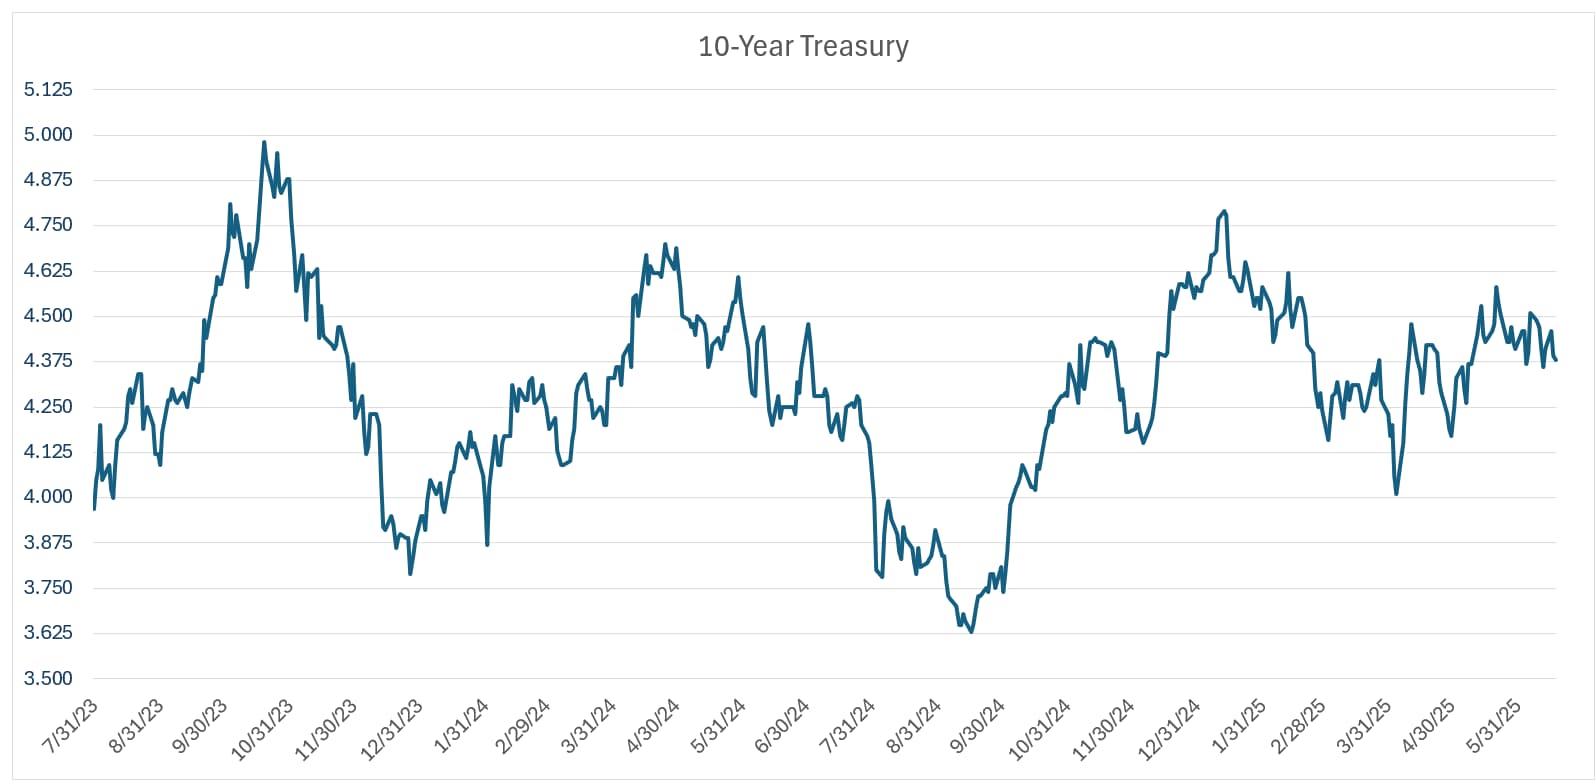
Monday and Tuesday brought a welcome decline in rates, driven by weaker-than-expected retail sales data. Retail sales fell 0.9% overall and 0.1% in core categories, signaling a potential economic slowdown. This spooked investors, who shifted toward safer assets like Treasury bonds, pushing the 10-year Treasury yield down from 4.46% to 4.38% (-8 bps over two days). Since mortgage rates often track the 10-year Treasury yield, mortgages also improved, pleasing borrowers.
Late-Week Rebound: Reality Bites
But by Thursday and Friday, the mood shifted. The Federal Reserve’s June 17–18 meeting minutes, confirmed no immediate rate cuts. This hawkish tone, combined with a slight uptick in consumer sentiment data on June 18, reignited fears of persistent inflation, nudging the 10-year Treasury yield back up to 4.44% (+6 bps).
Why This News Moved Rates
-
Retail Sales: Weak consumer spending suggests a cooling economy, reducing inflation pressures. Lower inflation expectations pulls down Treasury yields and mortgage rates, since it increases the probabilities of a Fed rate cut.
-
Fed Meeting: The Fed’s steady 4.25%–4.50% federal funds rate and cautious outlook signal no quick relief, keeping yields and rates elevated.
-
Consumer Sentiment: Rising confidence hints at stronger spending, which could fuel inflation, prompting investors to demand higher yields and pushing mortgage rates up.
Mortgages vs. Treasuries: A Widening Gap
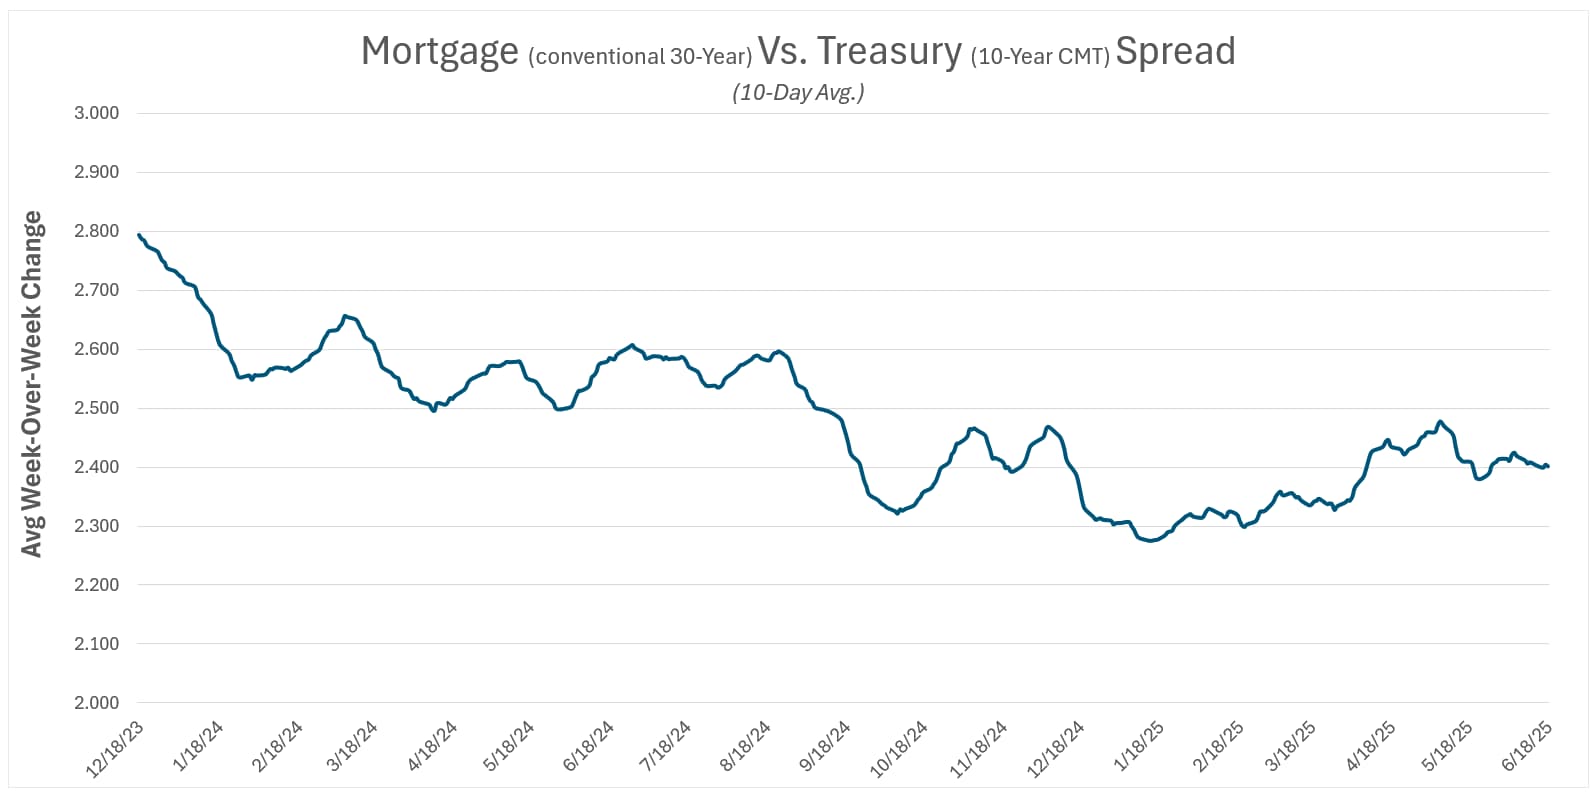
Mortgage rates slightly climbed more than Treasury yields, with the spread between 30-year fixed rates and 10-year Treasury yields widening from 2.38% to 2.42%. This is primarily due to concerns on rising delinquencies and defaults, especially for riskier loans like FHAs. ARMs saw a larger increase (+4 bps) than fixed-rate loans. ARMs are sensitive to short-term rate expectations, and the Fed’s steady policy stance raised concerns about future rate resets.
Longer-Term Trends: Zooming Out
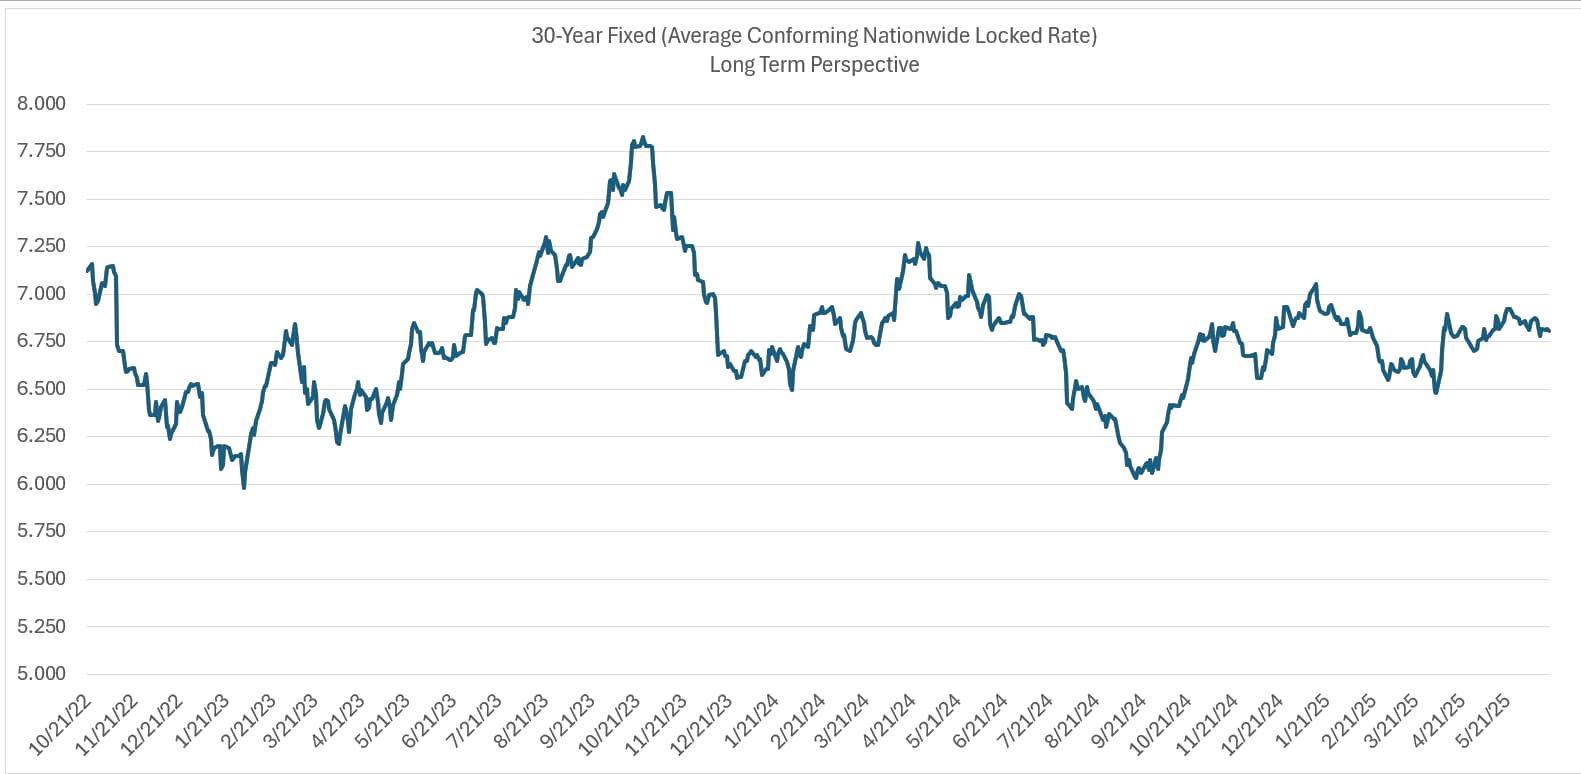
To put this week’s moves in context, let’s look at mortgage rate changes over the past 30, 90, and 180 days for 30-year fixed conventional loans:
-
Last 30 Days: +15 bps.
-
Last 90 Days: +25 bps.
-
Last 180 Days: +40 bps.
|
|
|
|
|
|
|
June Decision Recap:
On Wednesday, June 18th, the Federal Reserve’s Federal Open Market Committee (FOMC) held the federal funds rate steady, as widely anticipated. This marks the seventh consecutive meeting without a rate change, and financial markets responded with little volatility—indicating the pause was already priced in.
What’s Driving the Fed’s Stance?
The Fed emphasized that while inflation has cooled from its 2022 peaks, it remains “somewhat elevated”, particularly in core categories like housing and services. Chairman Jerome Powell noted that recent economic data has shown modest progress, but not enough to warrant a rate cut just yet. He also cited geopolitical risks and tariff uncertainty as potential upside risks to inflation.
Bottom line: The Fed is waiting for more decisive evidence—particularly from inflation and labor market data—before adjusting rates.
FOMC Language Shift:
The Fed continues to signal a “wait-and-see” approach. In their statement, they upgraded the description of the labor market to “solid,” suggesting it’s no longer overheating, but still healthy. The inflation language remained cautious, reflecting the Fed’s desire to avoid premature easing that could reignite price pressures.
What’s Next?
Markets are already looking ahead to the upcoming meetings:
-
July 30 FOMC Meeting:
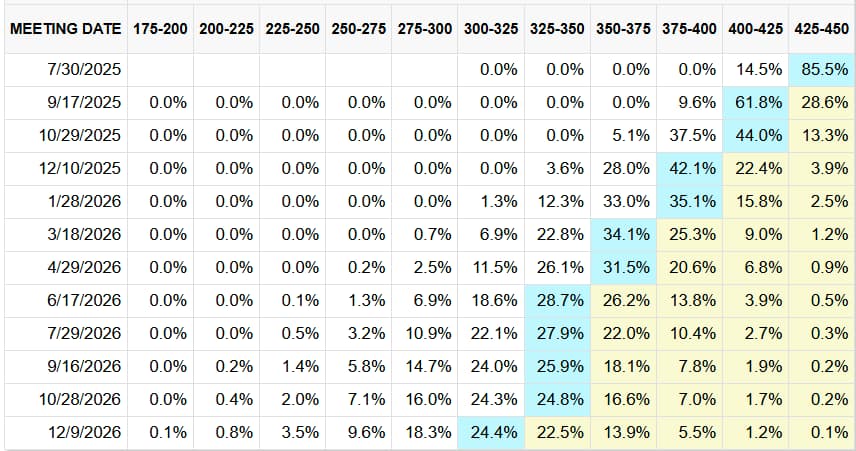
Futures traders currently assign only a 14.5% chance of a 0.25% rate cut, with an 85.5% probability of no change.
-
September 17 FOMC Meeting:
There’s more optimism here. Markets are pricing in a 61.8% chance of a 25 basis point cut, and a 9.6% probability of a larger 50 basis point cut.
These probabilities shift daily, driven by new data releases—especially key inflation reports (like CPI and PCE) and monthly jobs numbers. If inflation continues trending lower, the odds of rate cuts increase.
Why This Matters to Borrowers
The federal funds rate doesn’t directly control mortgage rates, but it strongly influences them—particularly short-term rates and expectations around inflation and economic growth.
-
When the Fed raises rates, borrowing becomes more expensive for banks, who then pass on those higher costs to consumers through higher mortgage rates.
-
When the Fed cuts rates, borrowing costs typically decline, which can ease mortgage rates and improve affordability—especially for buyers on the edge of qualifying.
Think of it as the Fed adjusting the economic “thermostat”:
Understanding these dynamics helps borrowers better time major decisions like locking in a rate, refinancing, or house-hunting.
|
|
|
Next FOMC Meeting: Wednesday, July 30
Current Fed Funds Rate Range: 4.25% – 4.50%
|
|
|
Fed Funds Probabilities Table
How to Interpret: The top row lists fed fund rate ranges. The left-most column lists upcoming dates for FOMC rate cut decisions. The values represent the probability of the fed funds rate lying in that range. Each row will sum to 100%. The probabilities are market-based and derived from the prices where futures contracts are trading.
|
 |
|
|
 |
|
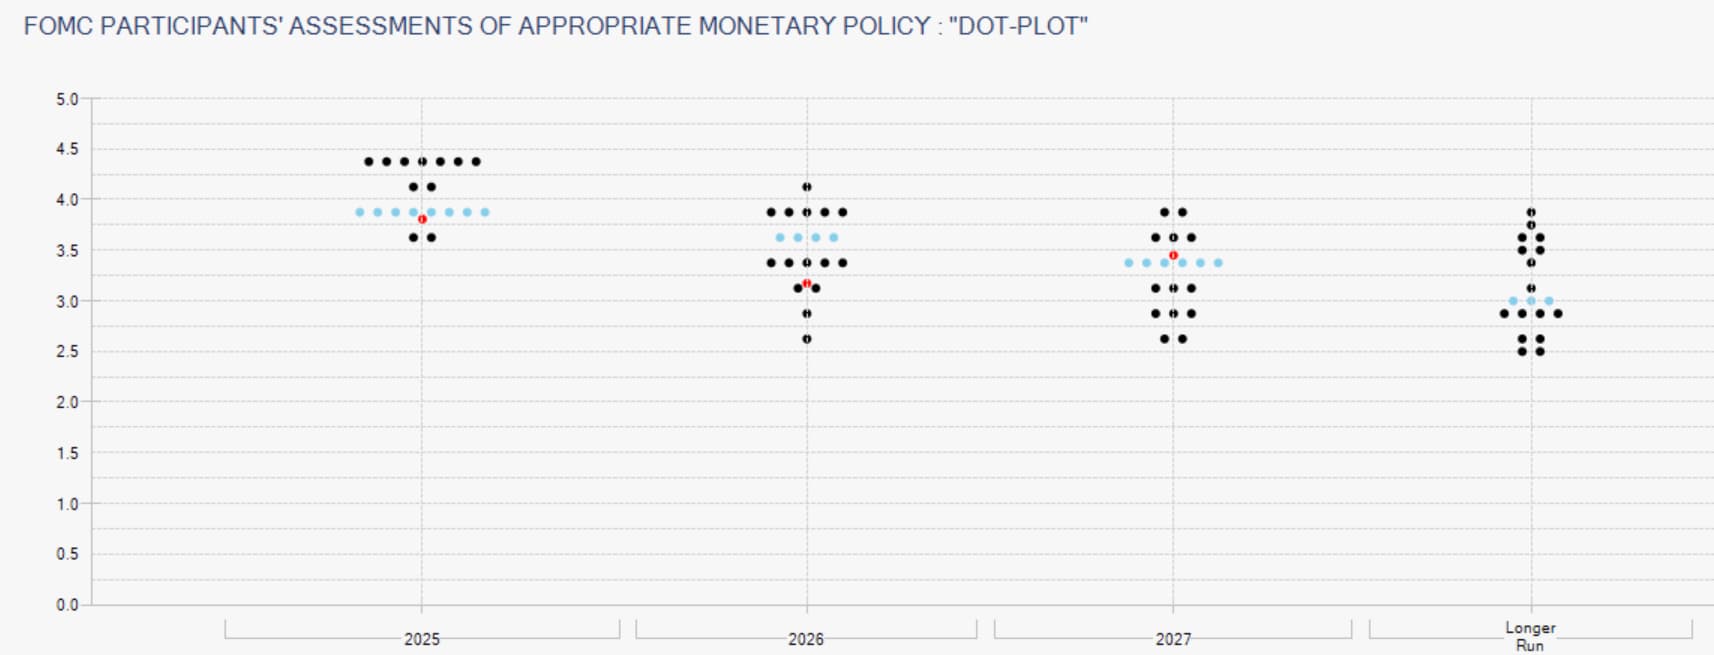
How to Read the Fed’s Dot Plot (chart below)
● Each dot represents one FOMC member’s forecast.
● There are 19 participants in the dot plot:
-
▪︎ 7 Fed Board Governors (nominated by the President and confirmed by the Senate
-
▪︎ 12 Regional Fed Bank Presidents
● The red dot shows the market’s forecast, based on the price where futures are trading.
● The blue dots represent the median forecast.
● The greater the dispersion in the dots, the less consensus between the participants.
Usefulness for Borrowers: Provides an educated indication of where the Fed Funds rate may be in future years.
|
|
|
|
|
|
|
|
Question: Why should I stay abreast of upcoming economic news?
Answer: Financial markets react to disparities between expected versus actual economic data. On days where highly anticipated economic data is released there is a greater likelihood of heightened volatility (risk). This is particularly relevant if you are locking it a rate.
|
|
|
|
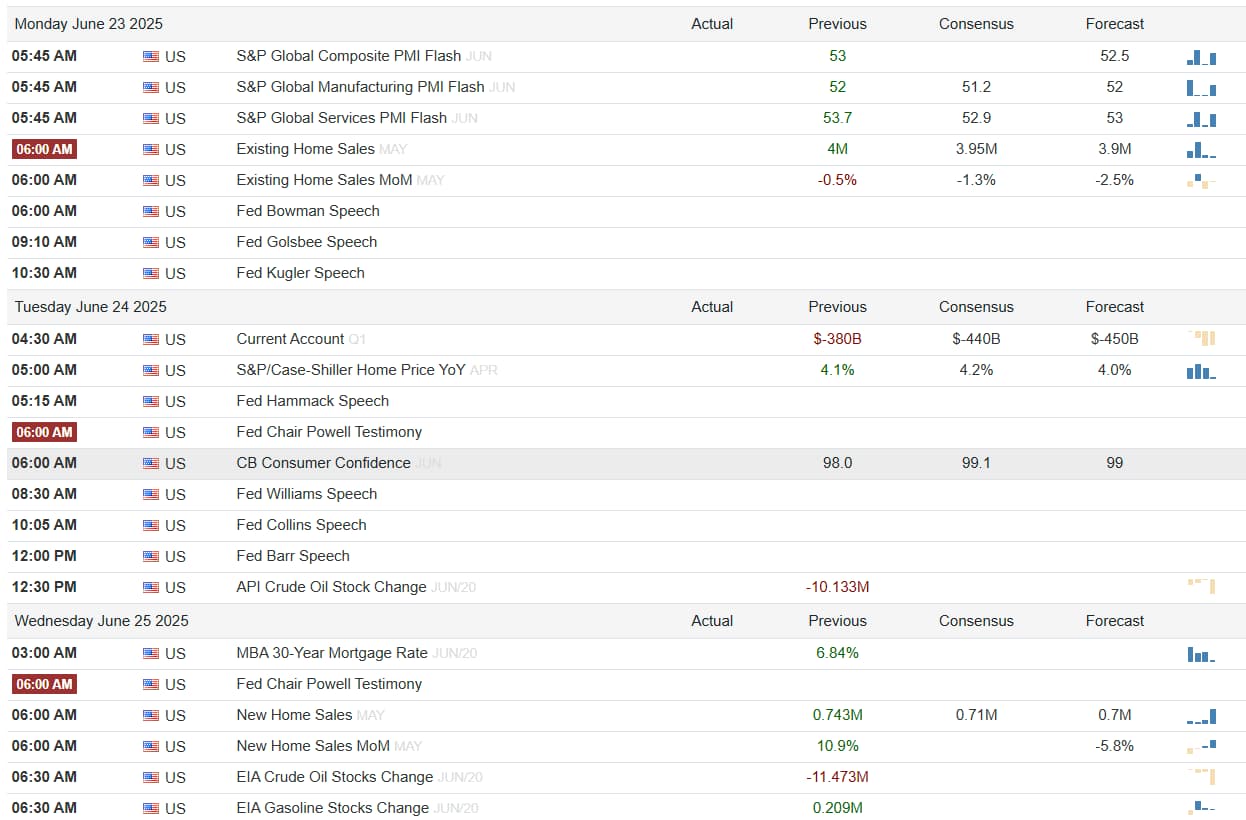
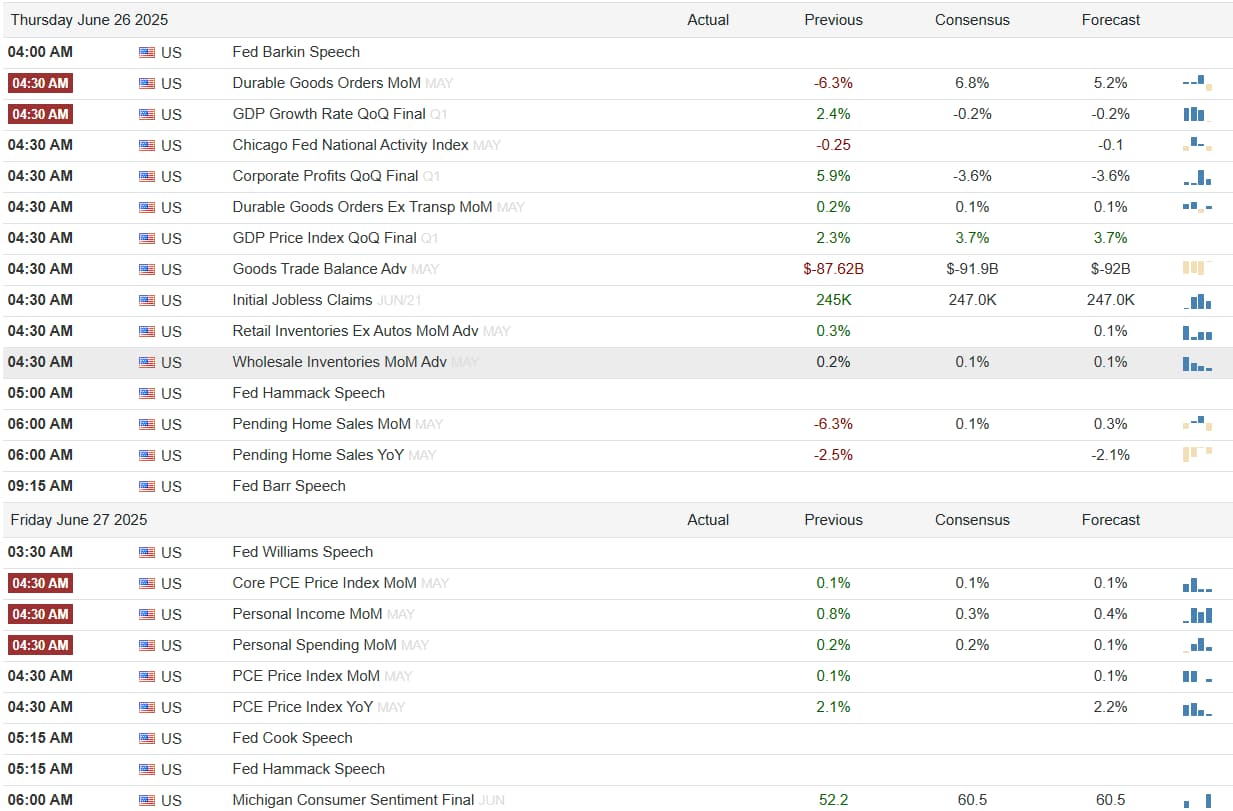
Here’s a rundown of this week’s key economic data being released — what’s coming & why it matters:
-
What: Consumer Confidence Index. The Consumer Confidence Index, measures how optimistic or pessimistic consumers are about the economy based on a survey of households. It reflects their willingness to spend or save, which drives economic activity.
-
When: Tuesday, June 24, 2025, 7:00 AM PST
-
Volatility Risk: 🔥🔥 (Moderate)
-
Market’s Expectation: Analysts expect the index to hover around 70–72, indicating cautious optimism due to stable employment but ongoing inflation concerns.
-
What to Watch For: A higher-than-expected reading could signal stronger consumer spending, potentially increasing inflationary pressures and pushing mortgage rates up. A lower reading might ease rate pressures by suggesting reduced economic activity.
-
Significance for Mortgage Rates: Consumer confidence influences economic growth, which affects Treasury yields and, consequently, mortgage rates. A strong report could widen the spread between Treasury yields and mortgage rates if lenders anticipate tighter Fed policy.
|
|
|
-
What: New Home Sales. The New Home Sales report, released by the U.S. Census Bureau, tracks the annualized number of newly constructed homes sold. It’s a key indicator of housing market health and broader economic activity.
-
When: Wednesday, June 25, 2025, 7:00 AM PST
-
Volatility Risk: 🔥🔥🔥 (High)
-
Market’s Expectation: Markets anticipate 650,000–670,000 annualized sales, a slight increase from prior months due to seasonal demand.
-
What to Watch For: A significant beat or miss could move bond markets. Strong sales indicate robust housing demand, potentially pushing mortgage rates higher, while weak sales could stabilize or lower rates.
-
Significance for Mortgage Rates: Housing demand directly affects mortgage market dynamics. Strong sales could tighten credit conditions, increasing rates, especially if Treasury yields rise in response to economic strength.
|
|
|
-
What: Gross Domestic Product (Third Estimate). The third estimate of GDP for Q1 2025, reported by the Bureau of Economic Analysis, provides a refined measure of economic growth, including consumer spending, business investment, and government activity.
-
When: Thursday, June 26, 2025, 5:30 AM ET
-
Volatility Risk: 🔥🔥 (Moderate)
-
Market’s Expectation: Analysts expect a slight revision from the second estimate, likely confirming steady but moderate growth.
-
What to Watch For: Upward revisions could signal stronger economic growth, potentially leading to higher mortgage rates, while downward revisions might ease rate pressures.
-
Significance for Mortgage Rates: GDP growth reflects overall economic health, influencing Fed policy and interest rates. Stronger-than-expected growth could prompt expectations of tighter policy, increasing mortgage rates.
|
|
|
-
What: Personal Consumption Expenditures (PCE) Price Index. The PCE Price Index, is the Federal Reserve’s preferred inflation measure, tracking price changes in goods and services consumed by households.
-
When: Friday, June 27, 2025, 5:30 AM PST
-
Volatility Risk: 🔥🔥🔥🔥 (Very High)
-
Market’s Expectation: Core PCE (excluding food and energy) is expected to rise 0.2% month-over-month, with annual inflation steady at 2.6–2.8%.
-
What to Watch For: A higher-than-expected reading could reignite inflation fears, pushing Treasury yields and mortgage rates higher. A lower reading might stabilize or lower rates by easing Fed tightening concerns.
-
Significance for Mortgage Rates: As the Fed’s primary inflation gauge, PCE directly influences monetary policy expectations. Persistent inflation could lead to expectations of tighter policy, increasing mortgage rates.
|
|
|
|
|
|
|
Housing Corner
|
Renting vs. Buying in 2025: Which Is More Cost-Effective for You?
As you plan your housing future in 2025, the decision to rent or buy is more complex than ever. Rising rents, fluctuating mortgage rates, and shifting market conditions—driven by economic policies like tariffs and evolving inflation trends—make it critical to weigh your options carefully. This article breaks down the financial and lifestyle factors to help you decide which path offers the most value, with practical tools and insights to guide your choice. Whether you’re a first-time homebuyer, a renter seeking stability, or someone reassessing your housing strategy, you’ll walk away with actionable steps to make an informed decision. At Integrity Capital Mortgage, we’re here to provide personalized guidance to help you navigate this choice with confidence, offering free consultations to explore your options without pressure.
The Big Picture: Housing Costs in 2025
The housing market in 2025 is shaped by several key trends:
-
Rising Rents: According to Zillow, average U.S. rental prices have increased 4.2% year-over-year, with median monthly rents reaching $2,050 for a two-bedroom home as of May 2025.
-
Mortgage Rates: The 30-year fixed mortgage rate hovers around 6.5–6.8% (nationally reported rate), influenced by the Federal Reserve’s steady federal funds rate (4.25%–4.50%) and tariff-driven inflation concerns.
-
Home Prices: Median home prices are up 3.8% to $425,000, driven by low inventory and rising construction costs.
-
Economic Context: Tariffs, implemented in early 2025, have increased construction material costs, pushing new home prices higher. The Fed’s cautious stance, with two projected rate cuts later in 2025, suggests mortgage rates may remain elevated in the near term, though experience a declining trend looking further out.
These factors create a challenging environment for both renters and buyers, but a detailed cost comparison can reveal which option better suits your financial goals.
Cost Comparison: Renting vs. Buying
To determine cost-effectiveness, let’s analyze a hypothetical scenario for a two-bedroom home in a mid-sized U.S. city in 2025, using national averages.
Renting Costs
-
Monthly Rent: $2,050 (national median for a two-bedroom apartment).
-
Renter’s Insurance: $15–$20/month ($18 average).
-
Upfront Costs: Security deposit (typically one month’s rent, $2,050) and potential broker fees ($500–$1,000).
-
Annual Cost: $2,050 × 12 + $18 × 12 = $24,816, excluding upfront costs.
-
Hidden Costs: Rent increases (4–5% annually) and limited control over maintenance or property decisions.
Buying Costs
-
Home Price: $425,000 (median single-family home).
-
Mortgage Payment: For a $425,000 home with a 20% down payment ($85,000) and a 30-year fixed mortgage at 6.7%, the monthly payment is approximately $2,250 (principal and interest).
-
Additional Costs:
-
Property taxes: $4,250/year (1% of home value, national average).
-
Homeowners insurance: $1,500/year ($125/month).
-
Maintenance: $4,250/year (1% of home value, industry rule of thumb).
-
Private Mortgage Insurance (PMI): $0 (avoided with 20% down).
-
Monthly Cost: $2,250 (mortgage) + $354 (taxes) + $125 (insurance) + $354 (maintenance) = $3,083.
-
Annual Cost: $3,083 × 12 = $36,996.
-
Upfront Costs: Down payment ($85,000), closing costs (2–5% of home price, ~$8,500–$21,250), and moving expenses (~$1,000).
-
Hidden Benefits: Potential home appreciation (3–5% annually) and tax deductions for mortgage interest and property taxes.
Break-Even Analysis
Renting is cheaper upfront and monthly ($2,068 vs. $3,083), but buying builds equity and offers potential appreciation. To break even, consider the break-even point—the time it takes for buying to become more cost-effective than renting due to equity growth and tax benefits.
-
Annual Cost Difference: $36,996 (buying) – $24,816 (renting) = $12,180.
-
Equity Build-Up: In year one, ~$6,000 of mortgage payments go toward principal (amortization schedule). Assuming 3% annual appreciation ($12,750), total equity gain is ~$18,750.
-
Tax Benefits: Mortgage interest (~$22,000 in year one) and property taxes ($4,250) may yield $5,000–$7,000 in tax savings (depending on tax bracket).
-
Net Cost of Buying: $36,996 – $18,750 (equity) – $6,000 (tax savings, midpoint) = $12,246.
-
Break-Even Point: The costs are nearly equal in year one ($12,246 vs. $12,180). Over 5–7 years, buying typically becomes more cost-effective if home values rise and rent increases continue.
Key Takeaway: Renting is more cost-effective for short-term stays (1–3 years) or if you lack down payment savings. Buying makes sense for longer-term plans (5+ years) in markets with stable appreciation. Integrity Capital Mortgage can help you run a personalized break-even analysis to see how these numbers apply to your situation—just reach out for a no-obligation consultation.
Long-Term Benefits of Buying
While renting offers short-term flexibility, buying a home in 2025 can provide significant long-term advantages, especially if you plan to stay put for a decade or more:
-
Wealth Building Through Equity: Each mortgage payment reduces your loan balance, increasing your ownership stake. Over 10 years, assuming a $425,000 home at 6.7% with a 20% down payment, you’d build ~$80,000 in principal equity, plus potential appreciation (e.g., $127,500 at 3% annual growth). This equity can be tapped later via home equity loans or used when selling.
-
Hedge Against Rent Inflation: Rent increases of 4–5% annually can outpace inflation, doubling costs over 15–20 years. A fixed-rate mortgage locks in your housing payment, shielding you from rising costs. For example, a $2,050 rent today could reach $3,300 by 2035 at 4.5% annual increases.
-
Retirement Planning: Owning a home outright by retirement eliminates housing payments, reducing your cost of living. Renters face ongoing payments, which can strain fixed incomes.
-
Legacy Creation: A home can be passed to heirs, providing generational wealth or a family asset, unlike renting, which offers no residual value.
-
Community Investment: Homeownership ties you to a community, fostering social and economic stability, which can provide lifestyle benefits.
Lifestyle and Financial Considerations
Beyond dollars and cents, your decision hinges on lifestyle and financial priorities:
Advantages of Renting
-
Flexibility: Easier to relocate for jobs or lifestyle changes.
-
Lower Upfront Costs: No need for a large down payment or closing costs.
-
Predictable Expenses: No maintenance or repair costs, though rent hikes are possible.
-
Best For: Young professionals, those in transitional phases, or anyone prioritizing mobility.
Advantages of Buying
-
Equity Building: Payments contribute to ownership and potential wealth growth.
-
Stability: Fixed-rate mortgages offer predictable payments, unlike rising rents.
-
Personalization: Freedom to customize your home.
-
Best For: Families, those planning to stay 5+ years, or anyone seeking long-term financial benefits.
Risks to Consider
-
Renting Risks: Annual rent increases can erode savings, and you miss out on equity growth. Eviction risks or landlord decisions can disrupt stability.
-
Buying Risks: Home values may stagnate in some markets, and unexpected maintenance costs can strain budgets. Job loss or relocation could complicate things.
Practical Steps to Decide
To choose between renting and buying, follow these actionable steps:
-
Assess Your Timeline: If you plan to stay 1–3 years, renting is likely cheaper. For 5+ years, buying may save money long-term.
-
Calculate Your Budget: Use an online rent-vs-buy calculator, such as the one on the Integrity Capital Mortgage website, to compare costs based on your local market. Include all costs, like maintenance and taxes.
-
Check Your Finances: For buying, aim for a 20% down payment to avoid PMI, a debt-to-income ratio below 43%, and a credit score of 620+ for better rates.
-
Research Local Markets: Compare rent and home price trends in your area. Markets with high rent growth favor buying; stable home prices favor renting.
-
Consider Lifestyle: Value flexibility? Renting may suit you. Crave stability and personalization? Buying aligns better
Key Takeaways for 2025
-
Short-Term: Renting is more cost-effective for stays under 3 years due to lower upfront and monthly costs.
-
Long-Term: Buying becomes cheaper after 5–7 years, offering equity, tax benefits, and protection against rent hikes, plus wealth-building opportunities over decades.
-
Market Context: Rising rents and home prices make buying attractive in high-growth areas, budget expected expenses for both scenarios.
-
Personalized Decision: Your choice depends on financial readiness, lifestyle goals, and local market trends.
At Integrity Capital Mortgage, we believe in empowering you with the knowledge and tools to make the best housing decision. Whether you’re leaning toward renting or buying, our team is happy to answer any questions you may have.
|
|
|
|
|
|
|