Mortgage Matters With Integrity

Written & Prepared by:  Brian Tilton

April 1, 2026


Wars, Oil Shocks, and Mortgage Rates:  

What History Teaches Us & What the Iran Conflict Means for Borrowers

The ongoing conflict with Iran has pushed mortgage rates higher in recent weeks as surging oil prices and renewed inflation concerns ripple through financial markets. This article explains the underlying economics linking wars, oil shocks, and mortgage rates, looking at how conflicts typically affect borrowing costs in the days, months, and years after they begin. We will also highlight what makes the current Iran conflict different — especially its direct impact on global oil supplies — and outline what it will take for rates to improve again. Our goal is to empower you with clear, unbiased information so you can make more informed decisions about buying a home or refinancing.


The Economics:  Why Wars Move Mortgage Rates

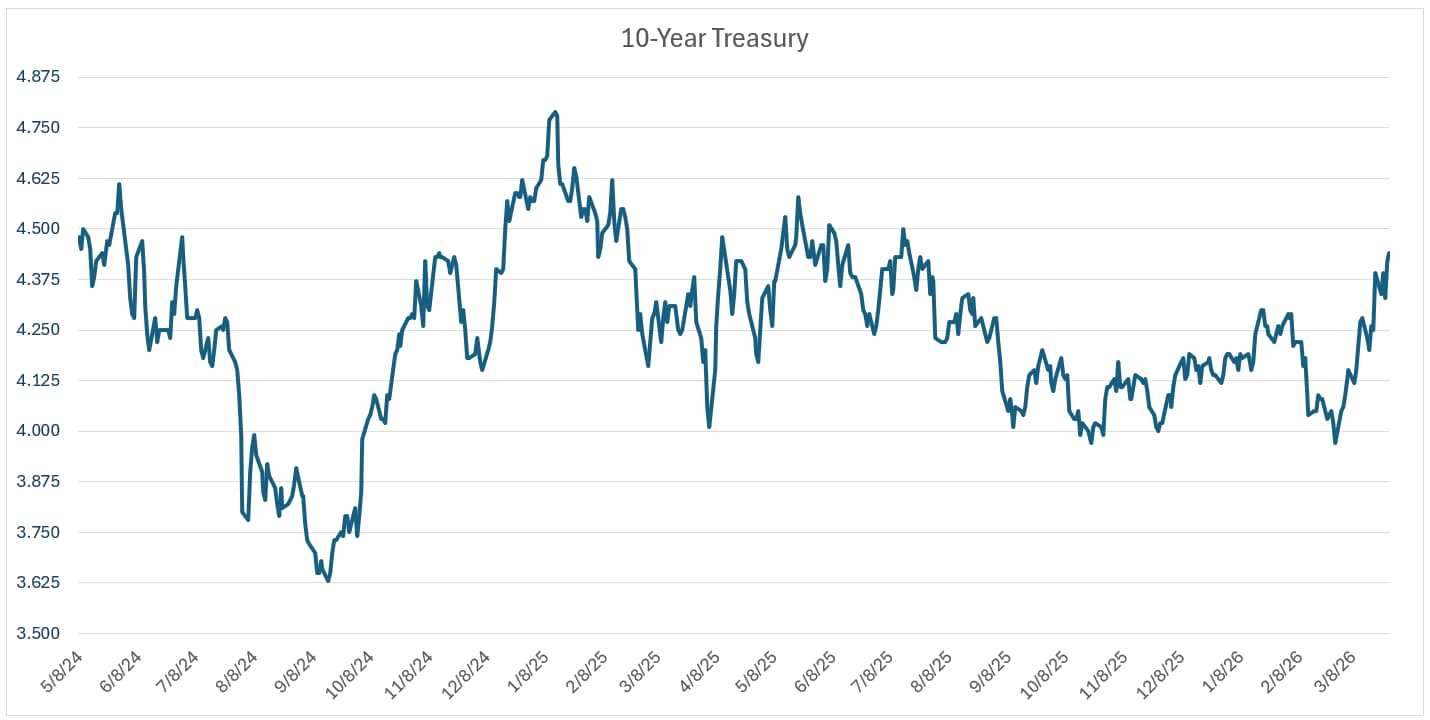
Mortgage rates closely track the 10‑year U.S. Treasury yield plus a risk‑based premium that compensates investors for prepayment, credit, and liquidity risk. Three main forces drive that 10‑year yield during times of war:

  • Safe‑haven demand and risk appetite — In the first hours or days of a new conflict, investors often sell riskier assets like stocks and move into safe‑haven assets such as U.S. Treasuries. This “flight to safety” pushes Treasury prices up, yields down, and can lead to a brief improvement in mortgage rates.

  • Inflation Expectations — When investors expect higher inflation, they demand higher yields so that their real return (after inflation) is protected. Wars can fuel inflation in two ways:​

    • Higher government spending and deficits (more money chasing the same amount of goods and services).​

    • Supply disruptions, especially in energy, which raise transportation and production costs across the economy (cost‑push inflation).

  • Central Bank and Policy Response — The Federal Reserve cannot pump oil or reopen shipping lanes; it can only influence aggregate demand by increasing the money supply or lowering the Fed Funds overnight rate. If the Fed fears that war‑related price spikes will feed into broader, persistent inflation, it is more likely to keep rates “higher for longer,” which holds Treasury yields and mortgages up. If instead it believes the war will slow growth more than it raises inflation, it can lean more dovish.


The Typical Timeline of Wars’ Impact on Mortgage Rates

  • Immediate Impact (First Days):  Financial markets dislike uncertainty.  When a war begins headlines lead to panic selling as assets are moved out of riskier investments, such as stocks, and into safe-haven investments, such as U.S. Treasuries.  This “flight to safety”  pushes Treasury prices higher and yields lower.  Since mortgages follow Treasuries, they indirectly benefit as well.

  • 1–3 Months In:  After the initial knee‑jerk reaction, markets re‑price based on the expected path of the conflict and the economy.​

    • If the war threatens energy or key supply chains, oil and other commodities often spike higher and stay elevated.​

    • Higher energy costs eventually show up at the gas pump, in utility bills, and in the cost of goods, reinforcing inflation concerns.​

At this stage, the fear shifts from “flight to safety” to “sticky inflation.”  Investors start to assume the Federal Reserve will either delay rate cuts or potentially tighten policy further, and longer‑term yields move higher. That is usually when mortgage rates rise and Fed rate cuts get “taken off the table.”

  • Longer-term Outcomes (6+ Months or Resolution): Over longer horizons, history suggests that war‑driven oil shocks are usually temporary, even if they feel endless while they are happening.​

    • Conflicts often move toward diplomacy or at least a managed stalemate.​

    • Other producers increase output, new supply routes open up, or demand falls as prices remain high.​

Once oil prices stabilize or decline and inflation expectations retreat, Treasury yields generally trend lower and mortgage rates follow. The timing and magnitude of that improvement depend on how quickly the conflict is contained and whether the Fed feels comfortable shifting its focus back to growth rather than inflation.​

What Past Wars Tell Us About Mortgage Rates

Here we can deepen the “history” section you already started by explicitly tying each conflict back to the safe‑haven vs. inflation framework.​

1990–1991 Gulf War

  • Initial phase: Oil prices jumped sharply as markets feared long‑lasting disruption in Middle‑East supply. Mortgage rates moved up by roughly 15–25 basis points in the early phase as inflation fears dominated.​

  • Subsequent months: Once it became clear that the U.S.-led coalition would prevail and that oil flows were stabilizing, safe‑haven demand and easing inflation concerns helped pull Treasury yields and mortgage rates down—by roughly 50–80 basis points or more over the next year.​

2003 Iraq War

  • Pre‑invasion: Uncertainty about timing and scope of the invasion pushed rates modestly higher—about 18 basis points in a single week—as investors priced in risk.​

  • Post‑invasion: Once the war actually began and some uncertainty cleared, safe‑haven flows into Treasuries contributed to a near‑term easing in mortgage rates. The conflict was still serious, but markets viewed the worst‑case scenarios as less likely.​

2022 Russia–Ukraine invasion

  • Early weeks: Mortgage rates briefly dipped by about 10–20 basis points as investors rushed into Treasuries amid fears of a broader European conflict.​

  • Later in 2022–2023: Persistent energy and food price shocks helped drive inflation to multi‑decade highs, and central banks responded with aggressive rate hikes. Mortgage rates then moved significantly higher as inflation, not fear, became the dominant driver.​

These examples show a consistent pattern: the mechanisms are repeatable, but the net effect on mortgage rates depends on whether the conflict ends up looking more like a short‑lived scare or a prolonged inflation shock.​

Why the 2026 Iran Conflict is Different

The current Iran conflict is behaving much more like an oil‑driven inflation shock than a classic flight‑to‑safety event.​

  • Iran exerts influence over the Strait of Hormuz, a chokepoint through which roughly one‑fifth of global seaborne oil flows.​

  • Attacks and disruptions in this region have created genuine supply constraints, not just headline risk.​

  • Oil prices have surged, and markets now expect energy‑driven inflation to be higher and more persistent than they did earlier in the year.​

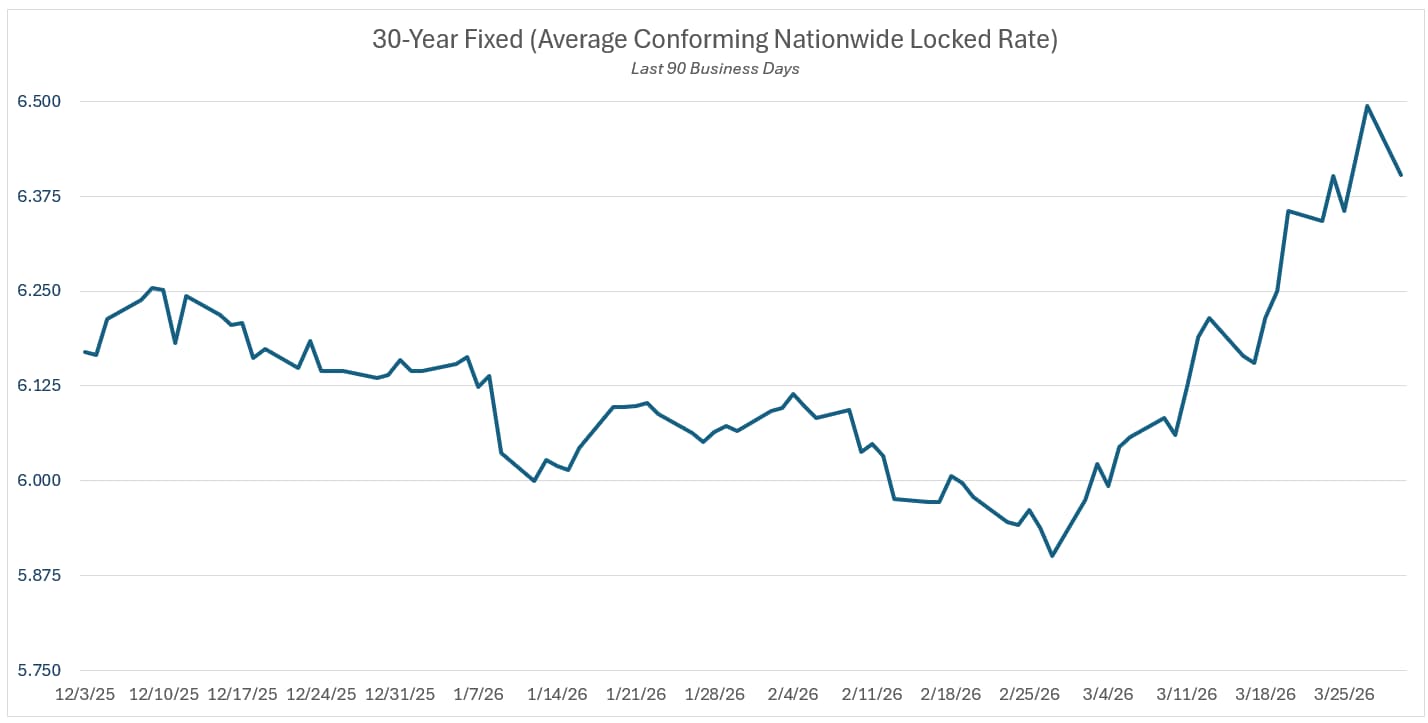
As a result, mortgage rates have risen by roughly 30 basis points since late February, making this episode more immediately painful for borrowers than some past conflicts that initially pushed rates lower. In other words, this is a war‑driven inflation story, not a war‑driven recession scare.​

Why the Strait of Hormuz Matters So Much

The Strait of Hormuz is a narrow waterway between Iran and Oman that connects the Persian Gulf to the wider world. It is the single exit route for most of the oil produced by the major Gulf exporters, which makes it the most important energy chokepoint on the planet.

A few facts make its importance easy to explain to borrowers and agents:

  • Roughly 20%–21% of global daily petroleum liquids consumption—about 20–21 million barrels per day—moves through the Strait of Hormuz.

  • Around one fifth of the world’s liquefied natural gas (LNG), mostly from Qatar, also depends on this route.

  • An estimated 80% or more of the oil that passes through Hormuz is shipped to Asian buyers, including China, India, Japan, and South Korea.

The shipping lanes through the strait are only a few miles wide in each direction, so even the threat of disruption—let alone actual attacks on tankers or mines in the water—can cause immediate spikes in oil prices and in the insurance costs for ships transiting the region. Unlike some other maritime bottlenecks, there is no simple alternative sea route that bypasses the Strait of Hormuz for Gulf oil, which means that any closure or significant disruption quickly becomes a global problem, not just a regional one.

Why the U.S. Cannot Simply “take over” the Strait

At first glance, it might seem like the simplest fix would be for the U.S. Navy to “take control” of the Strait of Hormuz and guarantee free passage. In reality, there are serious legal, diplomatic, and military complications that make a full U.S. takeover far from straightforward.

Legally, the Strait of Hormuz is an international strait that lies between Iranian and Omani territorial seas and is governed—at least in theory—by the transit passage regime under the U.N. Convention on the Law of the Sea (UNCLOS). Neutral merchant ships are entitled to pass through, but both Iran and Oman have asserted broader rights to regulate or restrict warships and commercial vessels in ways that the United States considers “excessive maritime claims.” The U.S. conducts freedom‑of‑navigation operations to challenge those claims, even though the U.S. itself has not ratified UNCLOS, which creates additional legal ambiguity.

Militarily and politically, a full‑scale U.S. move to seize or “control” the strait would:

  • Risk direct confrontation with Iranian forces along a very narrow waterway, raising the odds of escalation, miscalculation, or attacks on shipping and coastal infrastructure.​

  • Likely be viewed by many countries—including some allies and major oil buyers—as an overreach that undermines their own claims to maritime rights, complicating coalition‑building.

  • Increase the legal exposure and war‑risk costs for commercial shipping, as insurers and shipowners invoke war‑risk clauses and may refuse to transit certain areas if they judge the risk too high.​

In other words, while the U.S. has significant naval power and already escorts or protects certain traffic, simply “taking control” of the Strait of Hormuz is not a quick or cost‑free solution. That is one reason why markets put so much weight on diplomatic off‑ramps and regional compromises rather than assuming a purely military fix.

A Potential Faster Path to Resolution: Trump’s Negotiating Power with China

There is a plausible off‑ramp that could end this conflict sooner than many expect—and with it, potentially reverse the recent spike in mortgage rates. The core idea is simple: President Trump has the ability to orchestrate an end to the war, China would strongly welcome that outcome, and that gives him room to negotiate favorable concessions from Beijing if he delivers peace.

China’s economy is already under pressure from slow growth and deflationary forces, and as one of the world’s largest oil importers it is highly exposed to any prolonged disruption in the Strait of Hormuz. Higher and more volatile energy costs hurt Chinese manufacturers, squeeze export margins, and complicate Beijing’s efforts to stabilize its domestic economy. In other words, China has a powerful incentive to see this conflict wound down and oil prices return to more stable, lower levels.

That is where Trump’s leverage comes in. If the U.S. successfully brokers an end to the conflict—through a mix of pressure on Iran, security guarantees to regional partners, and coordination with other major powers—China would be a major beneficiary. In that scenario, Trump could reasonably ask for, and potentially secure, meaningful concessions from Beijing in return for delivering a solution that protects China’s economic interests. Those concessions could come in the form of:

  • Reduced tariffs or trade barriers on key U.S. exports

  • Looser restrictions on select U.S. technology or financial firms operating in China

  • Commitments on intellectual‑property protections or market access that had been stalled in prior negotiations

From a markets and mortgage‑rate perspective, the sequence looks like this:

  • Trump engineers an end to the conflict and helps reopen the Strait of Hormuz.

  • Oil supply fears ease, crude prices fall back toward pre‑war levels, and inflation expectations cool.

  • With lower energy‑driven inflation risk, long‑term Treasury yields decline.  This in turns lowers mortgage rates.

This is of course a plausible scenario rather than a guarantee.

What Will It Take for Rates to Improve?

Mortgage rates will improve meaningfully once the oil-driven inflation shock clearly reverses and markets gain confidence that the improvement will hold. Key triggers include:

  • A credible ceasefire or diplomatic breakthrough that reduces the odds of a wider regional war.

  • Reopening and secure operation of the Strait of Hormuz, with oil flows normalizing.

  • Crude prices falling back toward pre‑war ranges and staying there long enough to show up in inflation data.

  • Inflation data confirming easing price pressure.

  • Clear signals from the Federal Reserve that it no longer sees the war as a major inflation risk, opening the door to future rate cuts.

When those pieces line up, the 10‑year Treasury yield will fall, and mortgage rates are likely to drop 30–50 basis points relatively quickly, with additional gradual improvement possible if conditions remain stable.​


Advice for You Right Now

  • If you have some timing flexibility, consider waiting and monitoring oil prices and diplomatic developments closely. Acting when conditions improve could allow you to secure a meaningfully lower rate.

  • Get pre-approved now, but hold off on locking your rate until you see clear signs of stabilization or improvement in the market.

  • If your timeline is rigid and doesn’t allow you to wait, explore options such as an adjustable-rate mortgage (ARM) that you can refinance once rates ease, or a 1-0 temporary buydown to lower your initial payments and give yourself breathing room until mortgage rates decline.

Global conflicts naturally create uncertainty, but understanding the economics behind them puts you in a stronger position to make confident decisions. While the Iran conflict has pushed mortgage rates higher in recent weeks, history shows these shocks are usually temporary—and the potential for diplomatic progress, particularly through U.S.-China channels, suggests relief could arrive sooner than today’s headlines indicate.

Interest Rate Trends

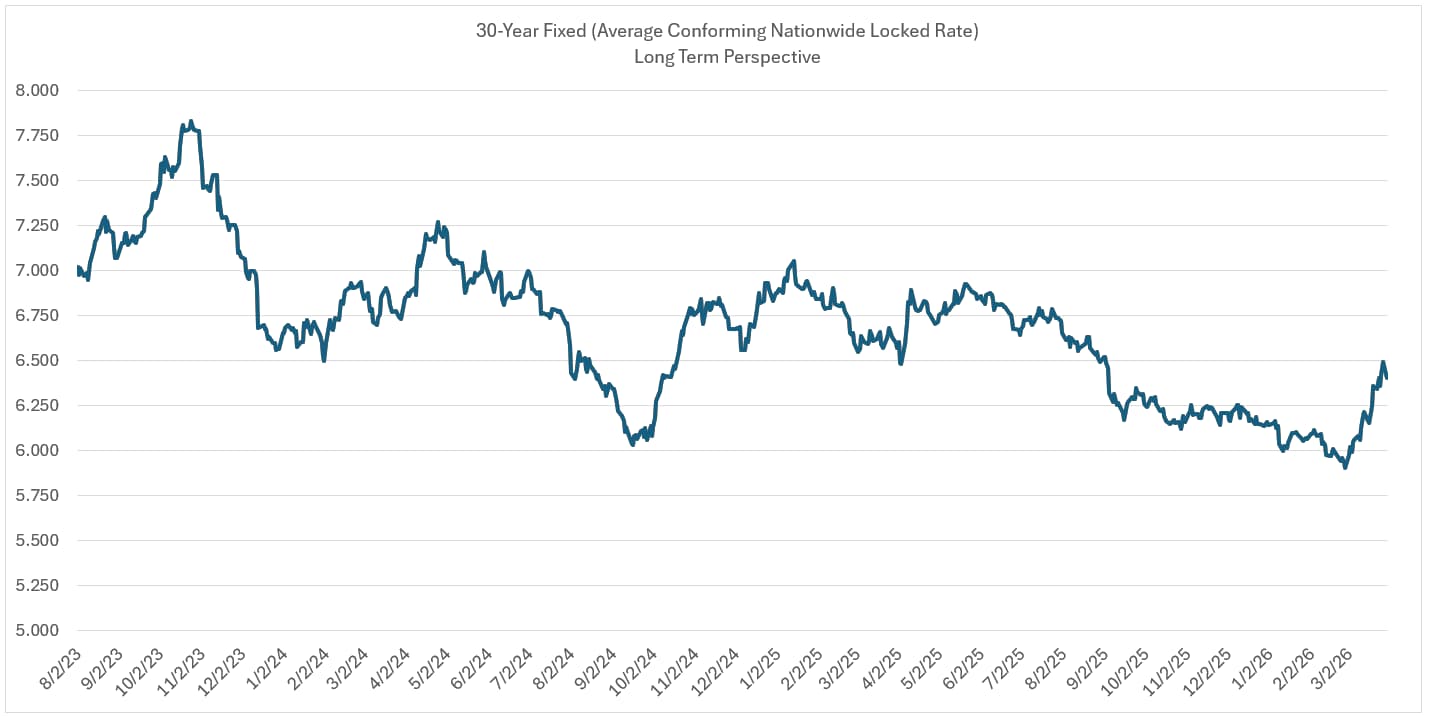
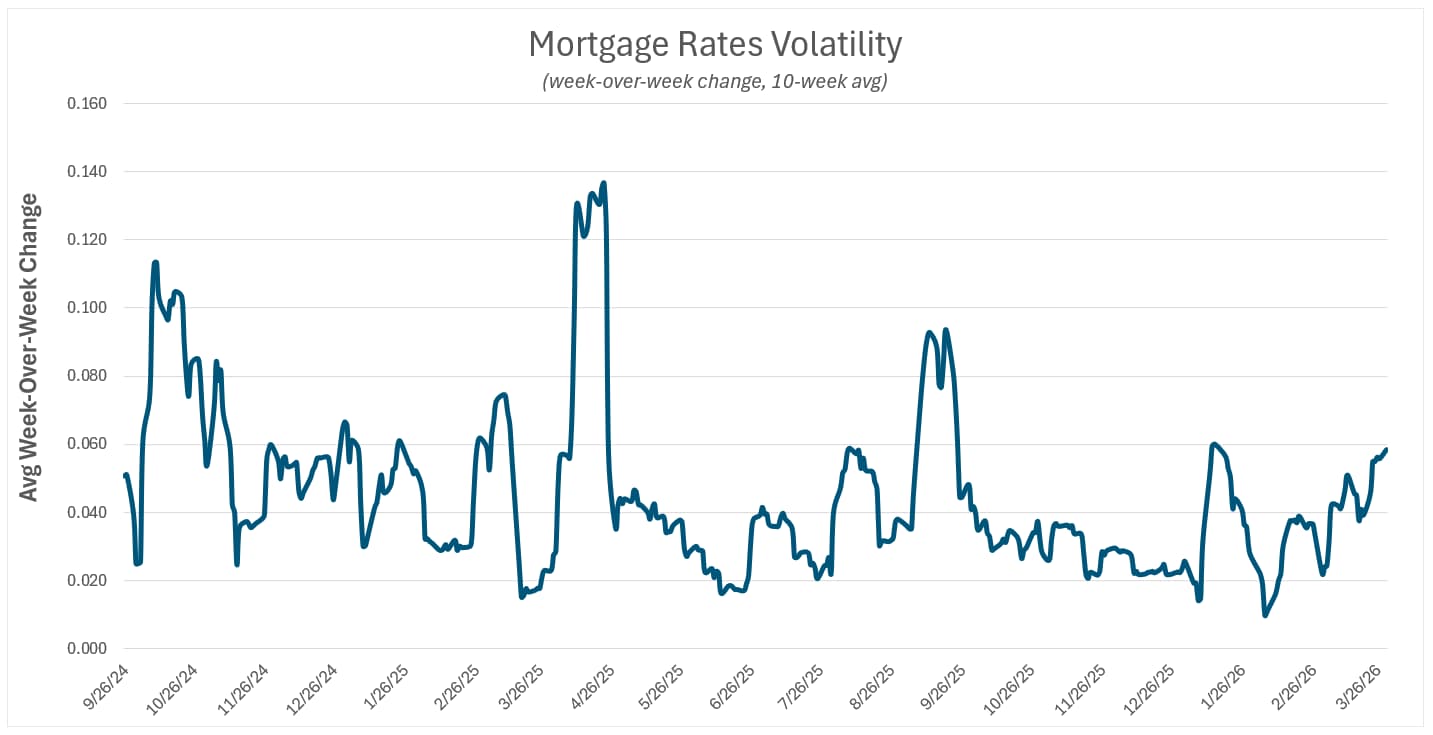
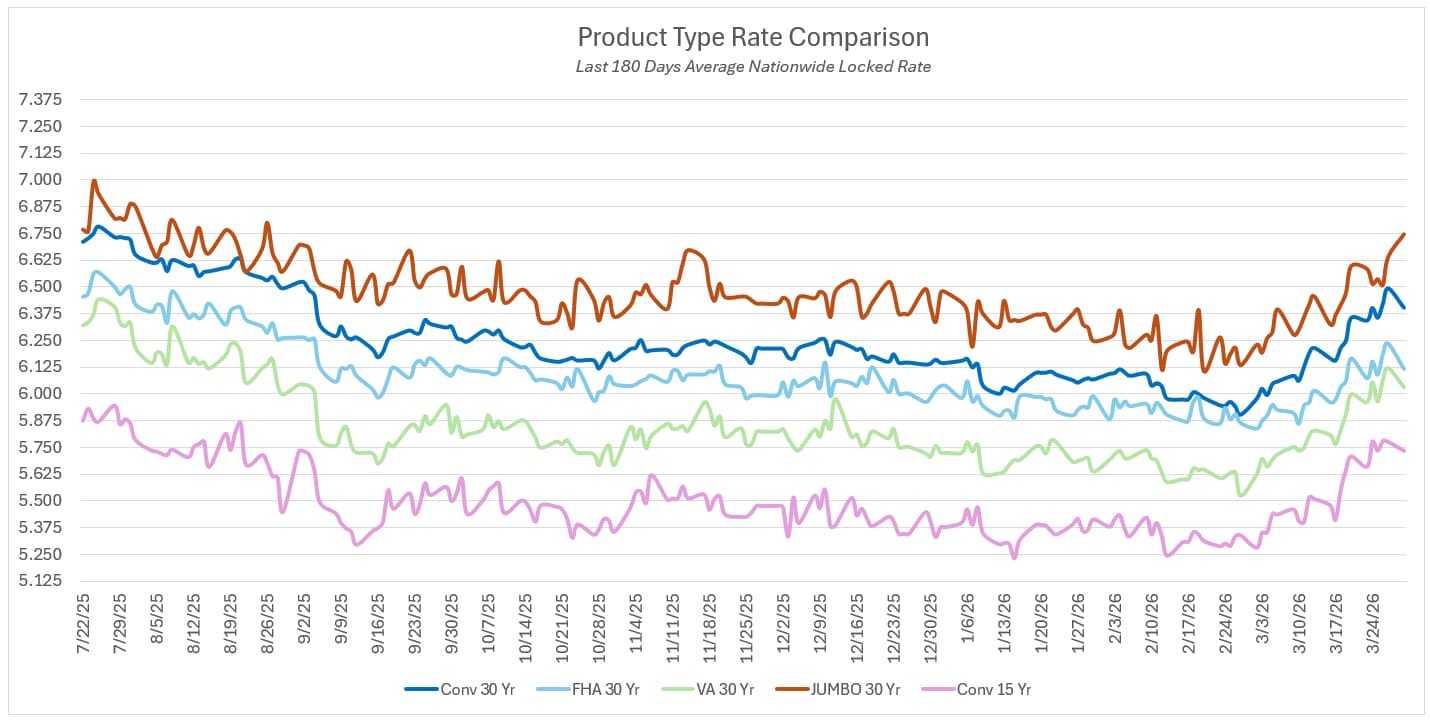
Over the last 45 days, its been a rollercoaster with mortgage rates rising across all product types in response to the inflationary effect of surging energy costs.  At this moment, the market is more focused on the war and oil prices, with economic data taking a back seat. Though this is a fluid situation and can shift at any time.

How much have rates changed recently?

While rates have risen across the board, the impact varies by loan terms and type.

  • Conventional 30-Year Fixed:  Up 0.40% – 0.55%.  This product type tends to be the most price sensitive since the duration is long and there is no explicit credit guarantee from the government.

  • Conventional 15-Year Fixed: Up 0.25% – 0.40%.  Due to the lower duration (average life) 15 year products have lower price volatility.

  • FHA & VA 30-Year Fixed:  Up 0.30% – 0.45%.  The increase in rates was a bit less than conventional since investor’s demand a lower risk premium due to the government’s explicit credit guarantee.

  • Jumbo Non-conforming:  Up 0.35% – 0.60%.  Rate changes are more investor/lender specific.

  • 5/6 ARMs: Up 0.15% – 0.30%.  The rise in rate was lower than fixed rates due to the shorter duration.

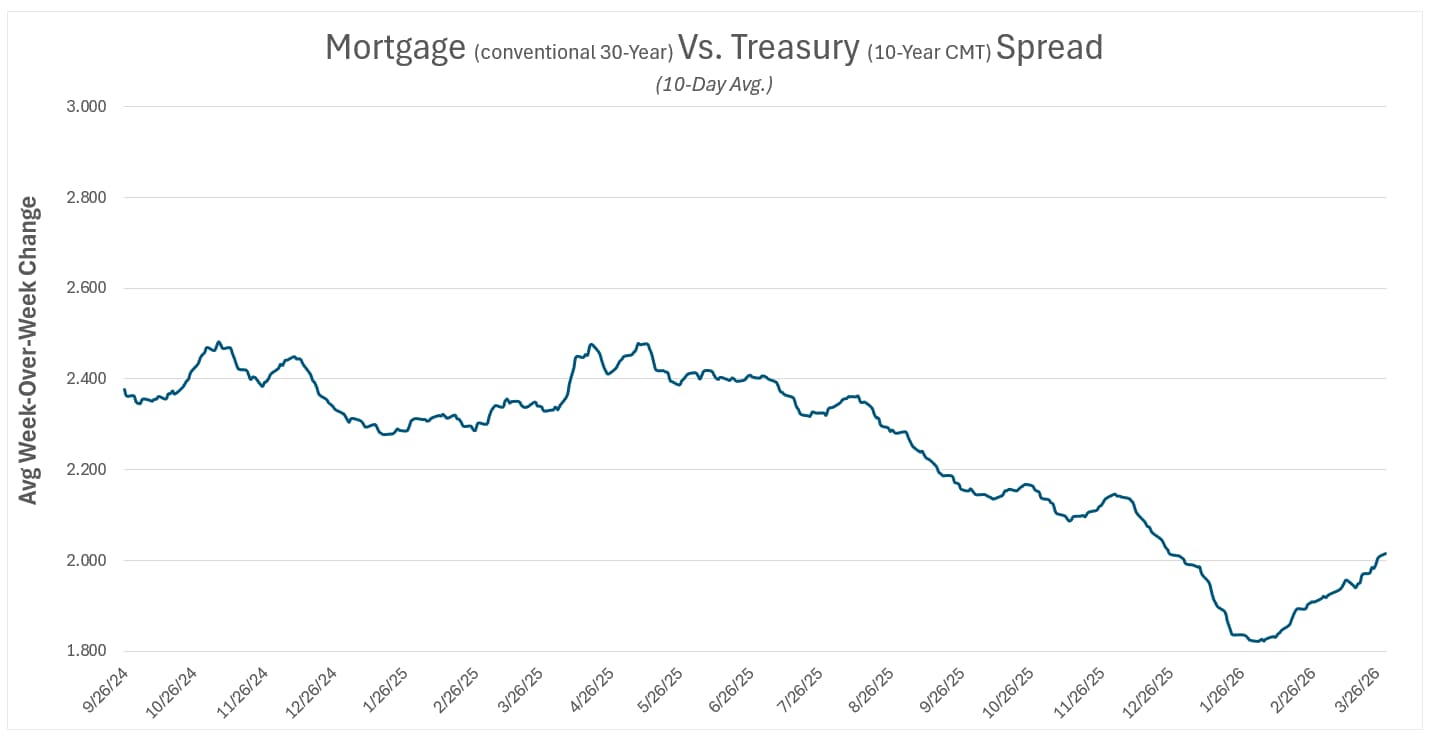
Mortgages vs Treasuries 

Spreads widened, meaning mortgage rates rose more than Treasury rates. Investors grew more cautious about locking in long-term loans when inflation worries heated up.

We also saw a steepening yield curve (the gap between short-term and long-term Treasury yields grew). Longer-term yields climbed faster than short-term yields, which is exactly why fixed-rate mortgages felt more pain than shorter-duration ARMs.

What’s Been Driving Rates?

No surprise here: surging oil prices tied to the ongoing Iran conflict. Crude oil spiked well above $100 a barrel in March, sparking fresh inflation fears. Higher energy costs ripple straight into the Consumer Price Index.  Bond investors hate uncertainty, so they demand higher yields. Add in the Fed’s cautious tone after its March meeting (no rate cut, and a slightly higher inflation forecast for the year), and you had the perfect recipe for upward pressure on both Treasuries and mortgages.

Other factors played supporting roles — a few hotter-than-expected economic data points and steady, but not booming, housing demand — but the oil shock was the headline driver.

Fed Watch

At their March 17-18, meeting, the Federal Open Market Committee (FOMC) kept rates on hold for the second straight time. The federal funds rate stays right where it’s been since late 2025: in the 3.50%–3.75% range. The vote was 11-1 (one policymaker wanted a cut, but the majority said “not yet”). Fed Chairman Powell’s message was clear: we’re watching the data extra carefully right now.

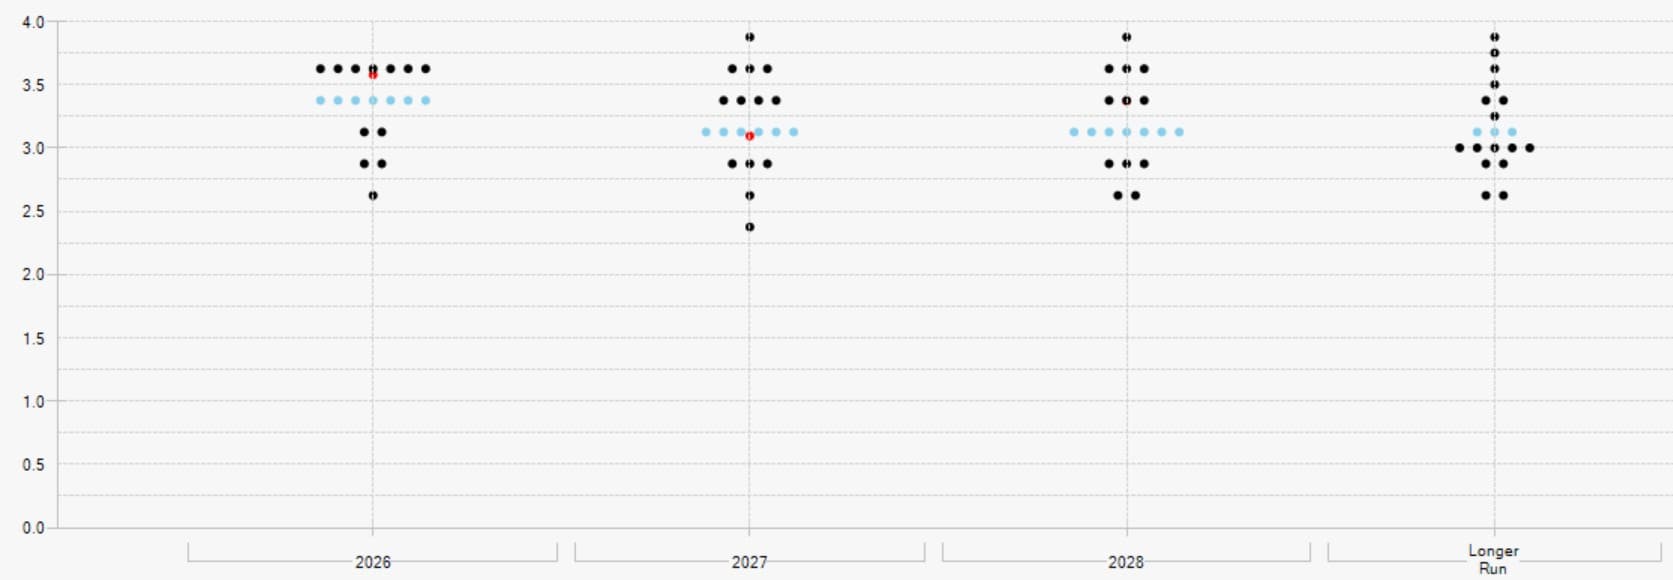
What’s driving the caution? Surging oil prices tied to the ongoing Iran conflict have completely reshaped the outlook. Oil spiked above $100 a barrel in recent weeks, pushing near-term inflation expectations higher and forcing the Fed to revise its 2026 inflation forecast upward to 2.7% for the year. Markets have reacted fast: probabilities for any rate cuts in 2026 have been slashed dramatically. The Fed’s “dot plot” (see below) still shows a median expectation of one 25-basis-point cut by year-end, but traders now see roughly a 77% chance of zero cuts in 2026; and even a small probability of a hike.

Why does this oil spike matter so much to Fed thinking? Energy prices flow straight into the inflation numbers (CPI & PCE). The Fed’s #1 job is keeping inflation anchored at 2%. A supply-shock like this isn’t something they can fix with rate cuts — in fact, cutting too soon could make inflation worse by giving households and businesses the green light to keep prices rising. Powell put it simply: we’ll “wait and see” how big and how long this shock lasts before deciding on any easing.

What if the war comes to an end? Good news there: oil prices tend to fall quickly once supply disruptions ease. A swift resolution could knock inflation expectations right back down, reopening the door to rate cuts sooner than the probabilities suggest. The Fed has said they can respond fast if the outlook improves — that fluidity is built into their meeting-by-meeting approach.

What should you expect at the next two Fed meetings?

  • April 28-29 meeting: Near-certainty of another hold (markets put the odds at 95%+ right now).

  • June 16-17 meeting: Still very likely a hold unless oil prices collapse or other data softens dramatically.

Next FOMC Meeting:  Wednesday, April 29th

 Current Fed Funds Rate Range:  3.50% – 3.75%

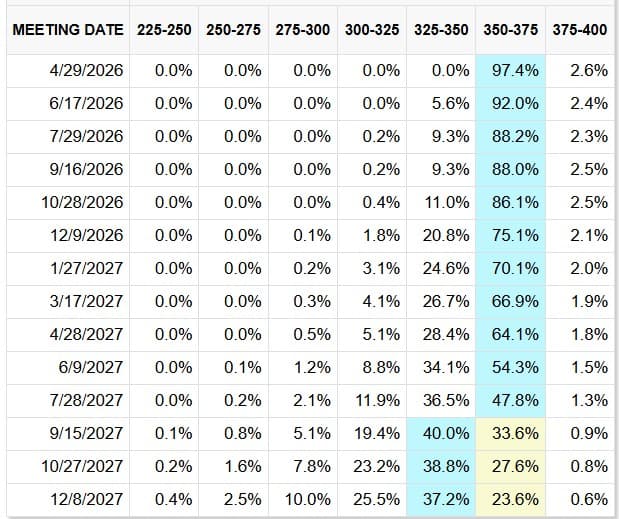
Fed Funds Probabilities Table

How to Interpret:  The top row lists fed fund rate ranges.  The left-most column lists upcoming dates for FOMC rate cut decisions.  The values represent the probability of the fed funds rate lying in that range.  Each row will sum to 100%.  The probabilities are market-based and derived from the prices where futures contracts are trading.

How to Read the Fed’s Dot Plot (chart below)

● Each dot represents one FOMC member’s forecast.

● There are 19 participants in the dot plot:

  • 7 Fed Board Governors (nominated by the President and confirmed by the Senate

  • 12 Regional Fed Bank Presidents

● The red dot shows the market’s forecast, based on the price where futures are trading.

● The blue dots represent the median forecast.

● The greater the dispersion in the dots, the less consensus between the participants.

Usefulness for Borrowers:  Provides an educated indication of where the Fed Funds rate may be in future years.

Economic Calendar


Question:  Why should I stay abreast of upcoming economic news?

Answer: Financial markets react to disparities between expected versus actual economic data.  On days where highly anticipated economic data is released there is a greater likelihood of heightened volatility (risk).  This is particularly relevant if you are locking in a rate.

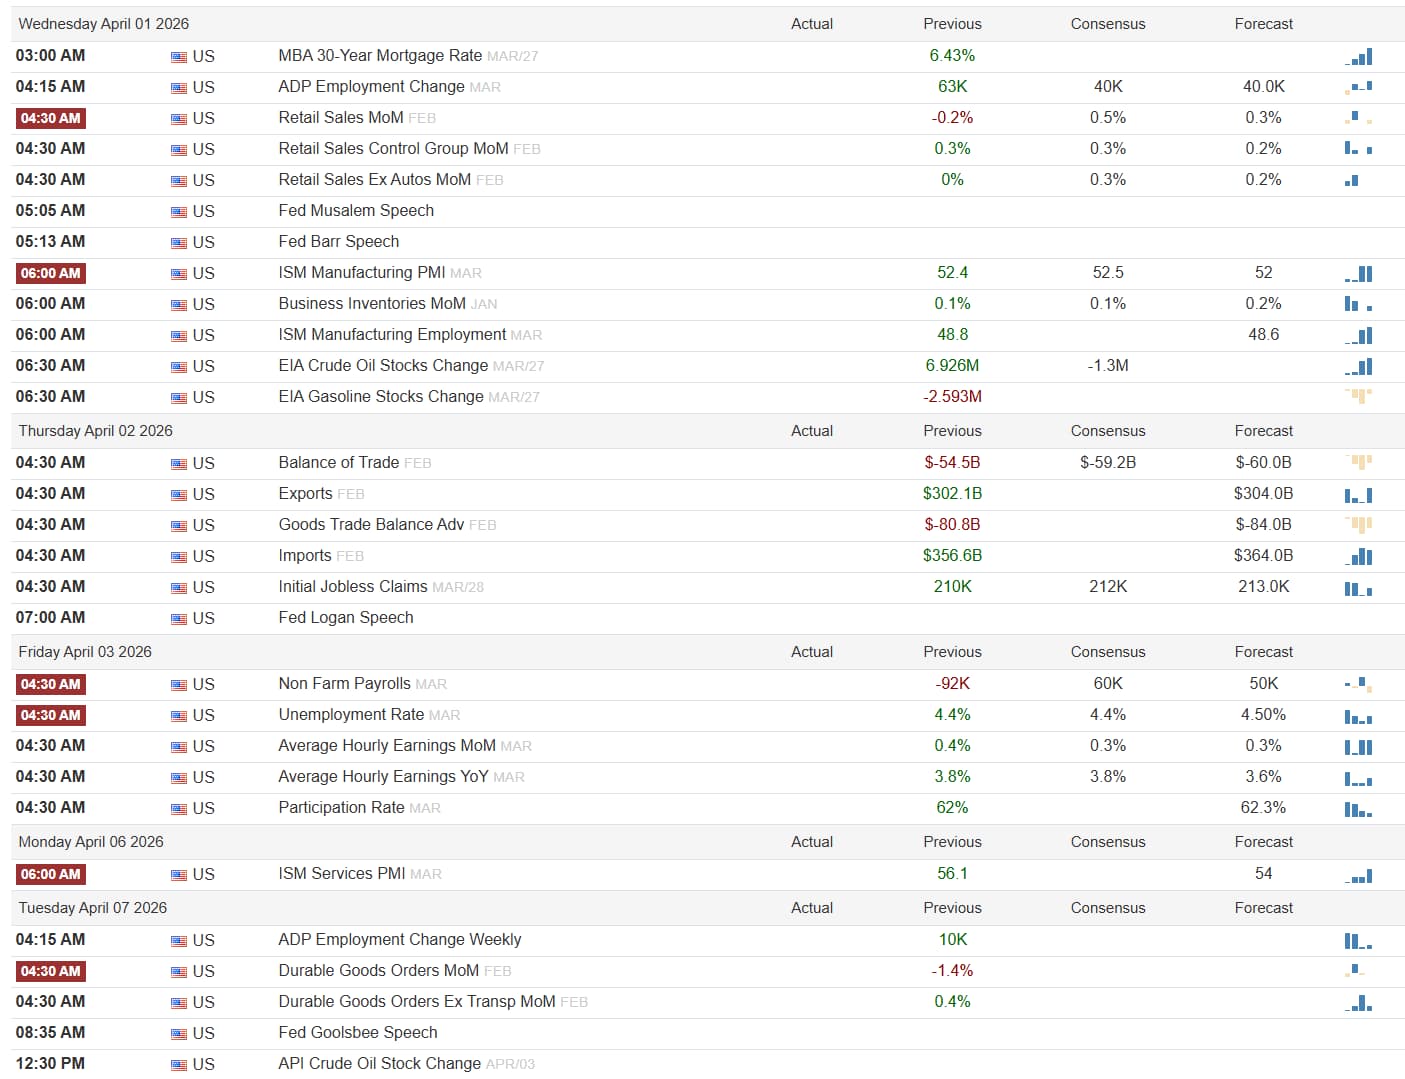
Here’s a rundown of this week’s key economic data being released  — what’s coming & why it matters (the full calendar is at the end of this section):

  • What: ADP National Employment Report.  This is a private-sector jobs snapshot from ADP, based on actual payroll records from ~400,000 U.S. businesses. It’s widely viewed as an early “preview” of the official government jobs report that comes two days later.

  • When: Wednesday, April 1, 5:15 AM PST

  • Volatility Risk: 🔥🔥 (Moderate)

  • Market’s Expectation: Roughly +40K private jobs added (down from +63K the prior month).

  • What to Watch For:  A big miss (much weaker than expected) or surprise strength — especially in the services vs. manufacturing breakdown.

  • Significance for Mortgage Rates: Stronger-than-expected hiring can push rates higher because it signals a still-solid economy (less chance of Fed cuts). A soft number tends to ease rate pressure. This report often sets the tone for Friday’s bigger jobs headline.

  • What: Retail Sales.  This measures how much Americans spent at stores, online, and on autos last month — the broadest gauge of consumer spending (which makes up ~70% of the U.S. economy).

  • When: Wednesday, April 1, 5:30 AM PST

  • Volatility Risk: 🔥 (Low)

  • Market’s Expectation: +0.3% to +0.5% month-over-month (modest rebound after recent softness)

  • What to Watch For: Core retail sales (excluding volatile autos and gas) — this strips out noise and shows underlying consumer health.

  • Significance for Mortgage Rates: Hot retail sales = stronger economy = potentially higher rates. Weak spending can signal cooling demand and give rates a little downward nudge.

  • What: ISM Manufacturing PMI.  The Institute for Supply Management’s monthly survey of ~400 purchasing managers in manufacturing. A reading above 50 means the sector is expanding; below 50 means contraction. It also includes price and employment sub-indexes.

  • When: Wednesday, April 1, 7:00 AM PST

  • Volatility Risk: 🔥🔥 (Medium)

  • Market’s Expectation: 52.5 (very slight expansion after 52.4 last month)

  • What to Watch For: The Prices Paid sub-index — this is the one that can spark inflation worries if it jumps again.

  • Significance for Mortgage Rates: This is a high-impact release for bonds and mortgages. A hotter-than-expected PMI (especially on prices) tends to push rates up because it reinforces sticky-inflation fears. A soft reading helps rates ease.

  • What: Initial Jobless Claims.  Weekly count of new people filing for unemployment benefits. It’s the most timely look at the labor market and tends to move markets when the 4-week average trends sharply higher or lower.

  • When: Thursday, April 2, 5:30 AM PST.

  • Volatility Risk: 🔥🔥 (Moderate)

  • Market’s Expectation: ~210K–212K (steady at low levels)

  • What to Watch For: Whether the 4-week average breaks above 215K — that would be the first clear sign of labor-market softening.

  • Significance for Mortgage Rates: Persistent low claims keep the “strong economy” narrative alive and can support higher rates. A surprise spike in claims usually helps mortgage rates fall.

  • What: Employment Situation Report / Nonfarm Payrolls.  The official U.S. jobs report from the Bureau of Labor Statistics. It includes total nonfarm payroll jobs added, the unemployment rate, wage growth, and hours worked — basically the Fed’s favorite snapshot of the labor market.

  • When: Friday, April 3, 5:30 AM PST.

  • Volatility Risk: 🔥🔥🔥 (High)

  • Market’s Expectation: ~+50K to +57K jobs added; unemployment rate steady around 4.4%

  • What to Watch For: Wage growth (Average Hourly Earnings) and the unemployment rate — these two drive Fed thinking more than the headline job count.

  • Significance for Mortgage Rates: This is the single most important release next week. Hotter-than-expected jobs + wages = higher mortgage rates (signals no rush for Fed cuts). A weak report usually sends rates lower because it raises the odds of easier policy later this year. Expect bond-market volatility all morning.

Housing Corner

The U.S. housing market continues its gradual shift from being a seller’s market to a balanced leaning towards buyer’s market. Affordability challenges have resulted in slower sales paces, longer days on market, and more negotiating power for buyers in many regions. Nationally, active listings have grown considerably, median listing prices have softened slightly, and the market feels less frenzied than in earlier years. Widespread price crashes have not occurred, but price growth has moderated or turned modestly negative in high-cost areas while holding steadier elsewhere. This shift gives buyers more options and negotiating power compared to the tight markets of 2024 and early 2025, with seller concessions becoming increasingly more frequent.  This environment favors prepared buyers who can move decisively.

To provide more region specific and useful information this section will separately discuss the California, Texas, and Tennessee real estate markets.

California:  

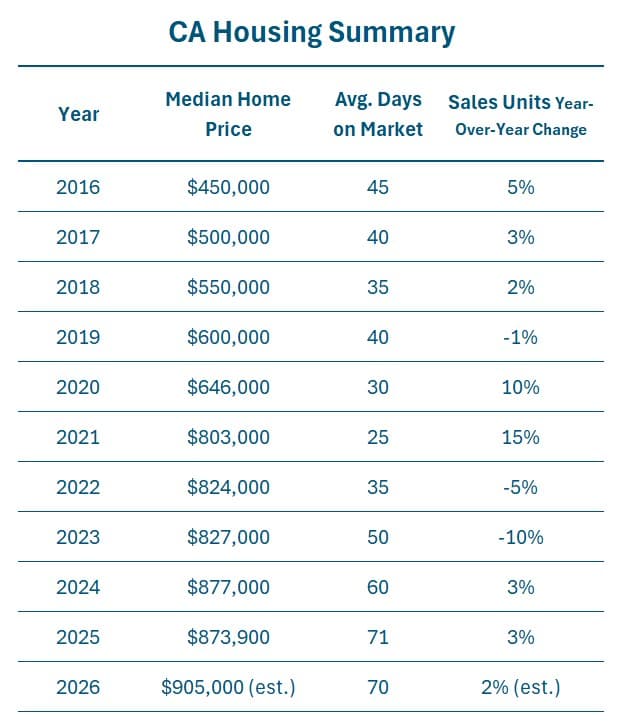
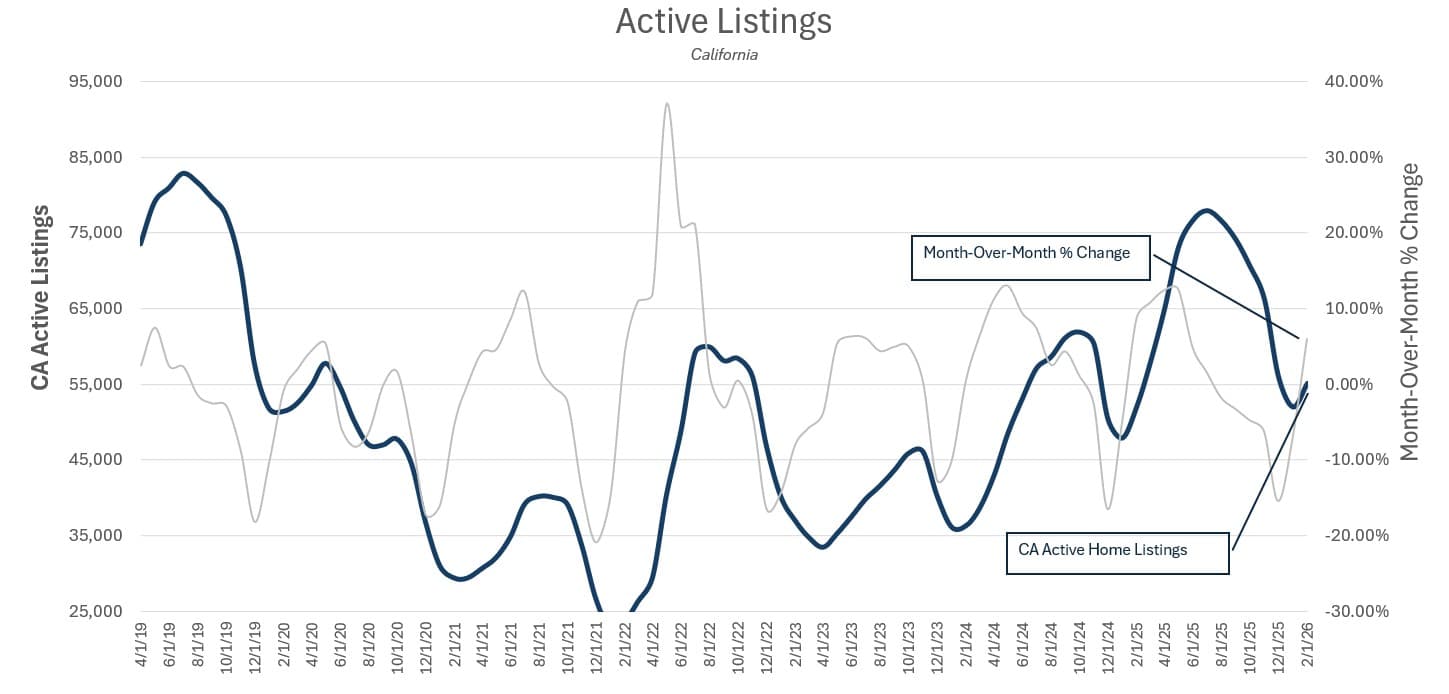
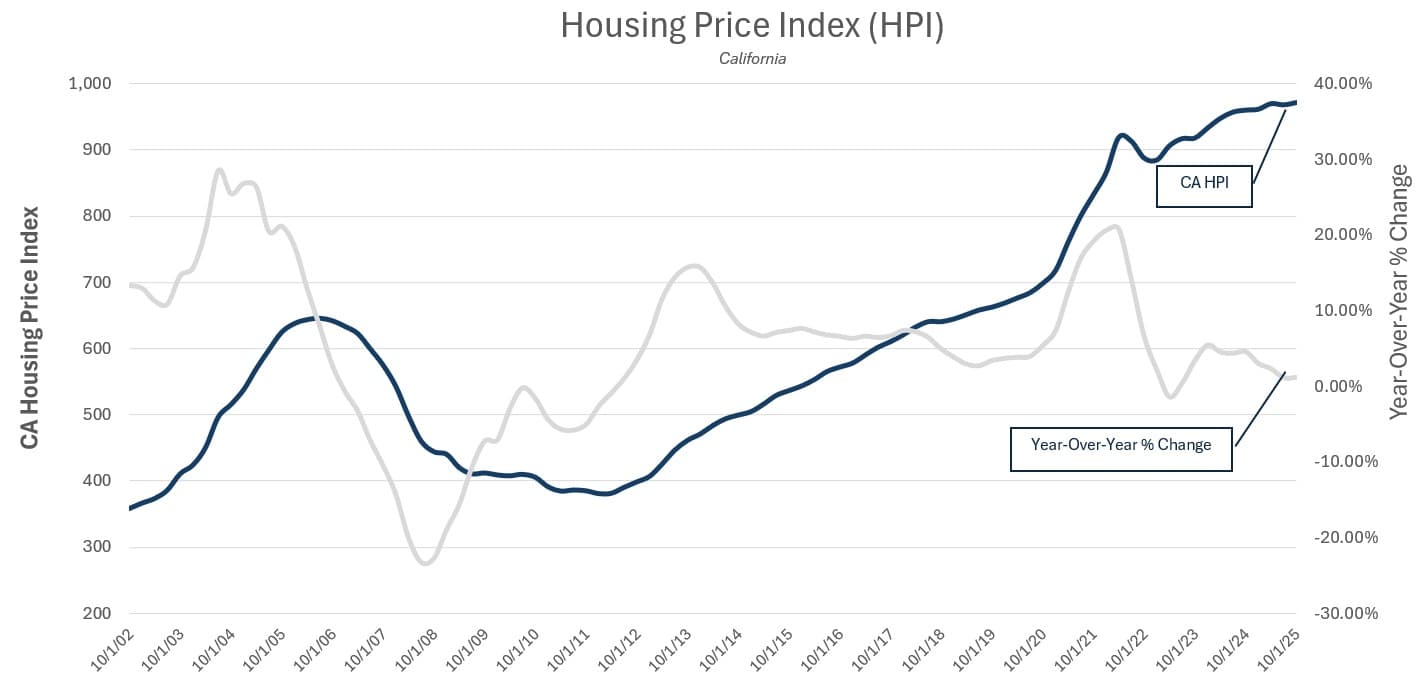
California’s market showed signs of stabilization in the most recent 1–3 months, with a notable sales rebound in February following softer winter activity. Statewide existing single-family home sales in February (seasonally adjusted annualized) increased 11.6% month-over-month and 2.6% year-over-year, marking it the strongest pace in over two years. Median prices held steady to slightly softer at $829,060 (up 2.8% Year-over-year but down 1.2% from January).  Inventory remained relatively tight but stabilized, with active listings down 4.2% year-over-year and months of supply around 4 months.  Days on market averaged 50 days.

The market is now balanced to buyer-friendly outside of coastal hotspots, with more negotiating room than in late 2024. Seller concessions are increasingly common, especially for rate buydowns or repairs. A hot topic for California buyers remains skyrocketing homeowners insurance premiums driven by wildfire risk.  Shop multiple carriers early and explore mitigation discounts to avoid sticker shock on monthly costs.

Buyer Interpretation: With sales picking up seasonally but days on market still elevated, this is a good window to negotiate firmly. Get pre-approved before making an offer and factor insurance into your budget; waiting for big price drops is risky given forecasts for modest gains.

Tennessee:

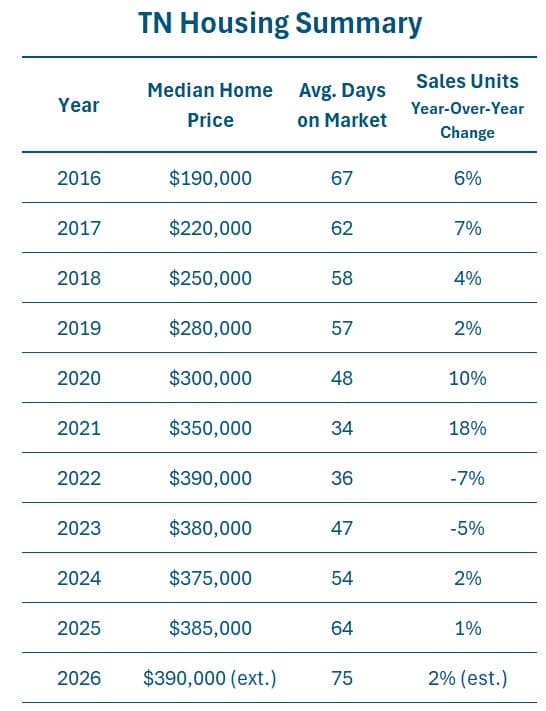
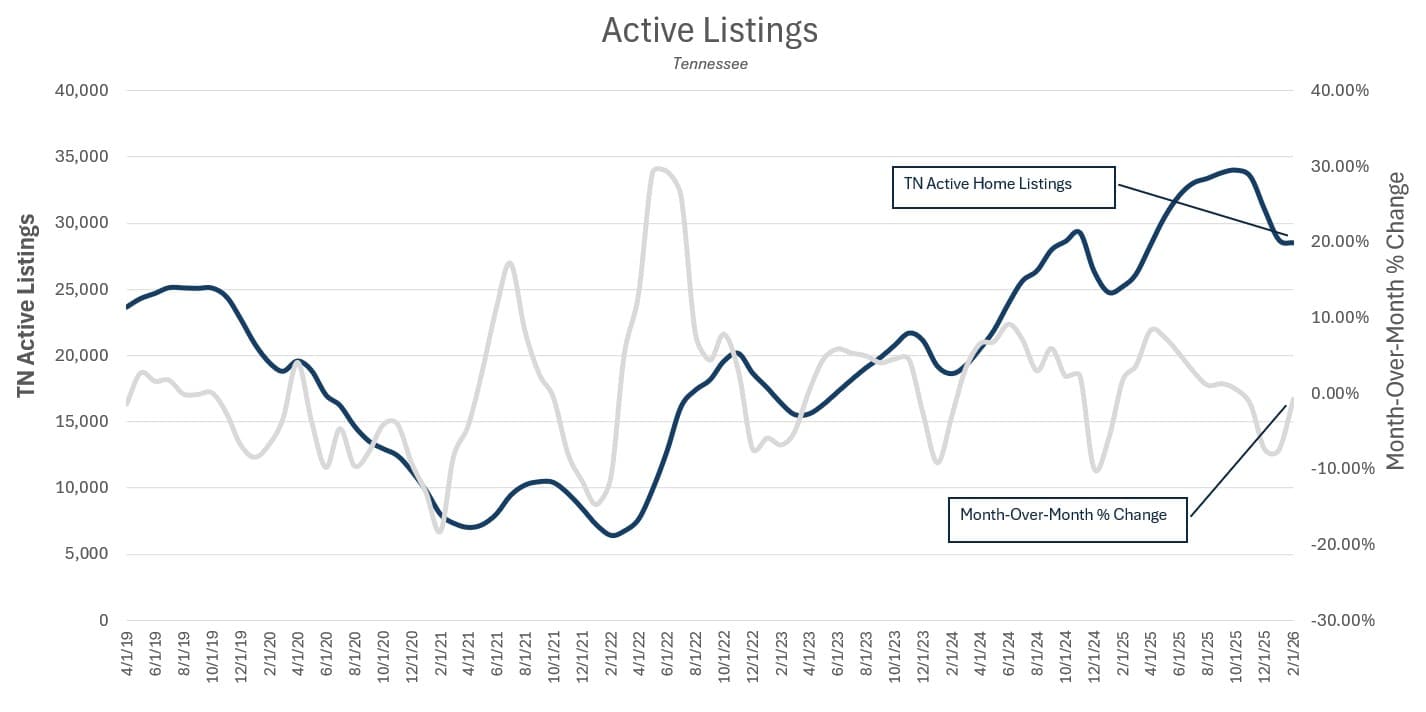
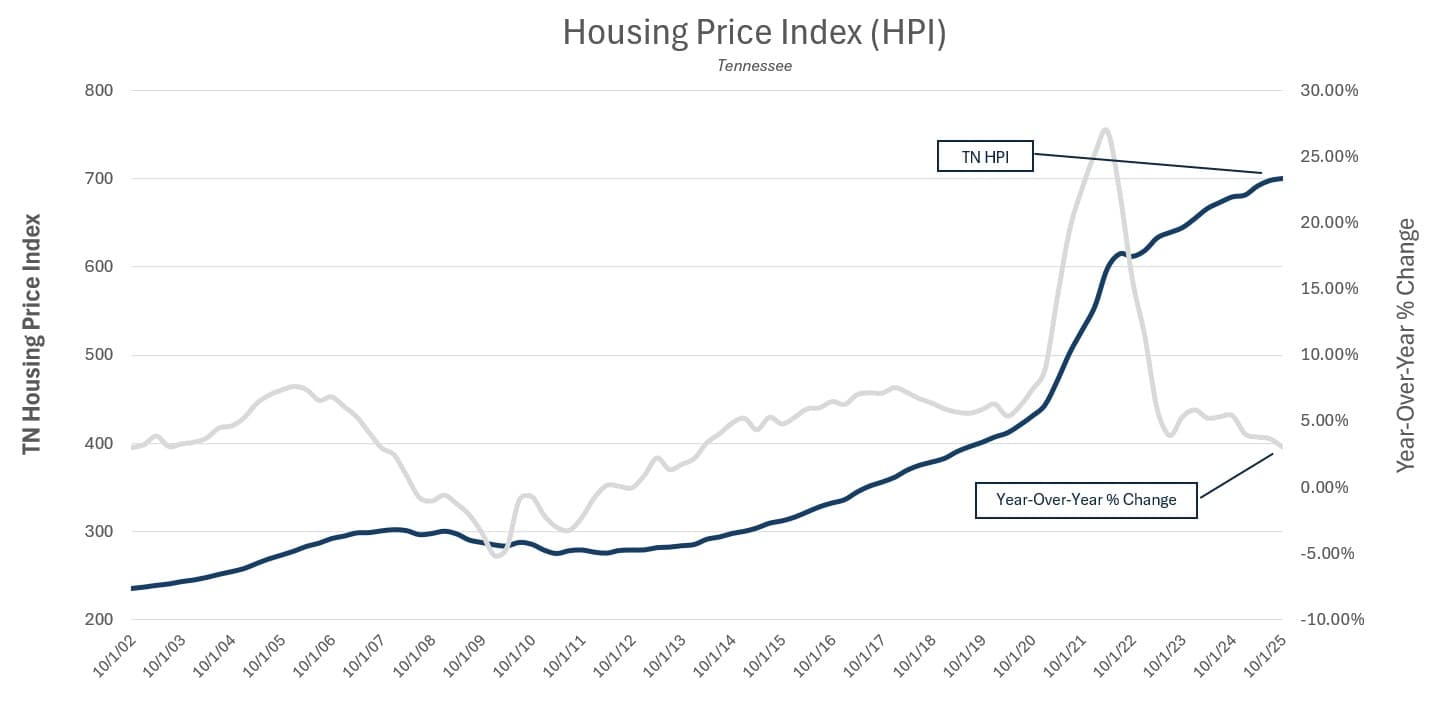
Tennessee’s market has remained relatively resilient over the past several months, with modest price gains and growing inventory creating supply/demand balance. The statewide median sell price came in at $386,400 in February, up 2.3% year-over-year. Sales were steady to slightly up (3.1% Year-over-year). Inventory grew solidly (up 10% year-over-year), pushing months of supply toward 5–6 and days on market to 90 days.

The market leans balanced to buyer-friendly, especially in suburban areas, with sellers more open to concessions as listings linger longer. Job growth in logistics and manufacturing continues to support demand, while new construction is helping ease entry-level shortages—a bright spot for first-time buyers.

Buyer Interpretation: Use the extra inventory to compare options and negotiate confidently. Focus on areas with strong employment; the added supply gives you time without rushing into a bidding war.

Texas:

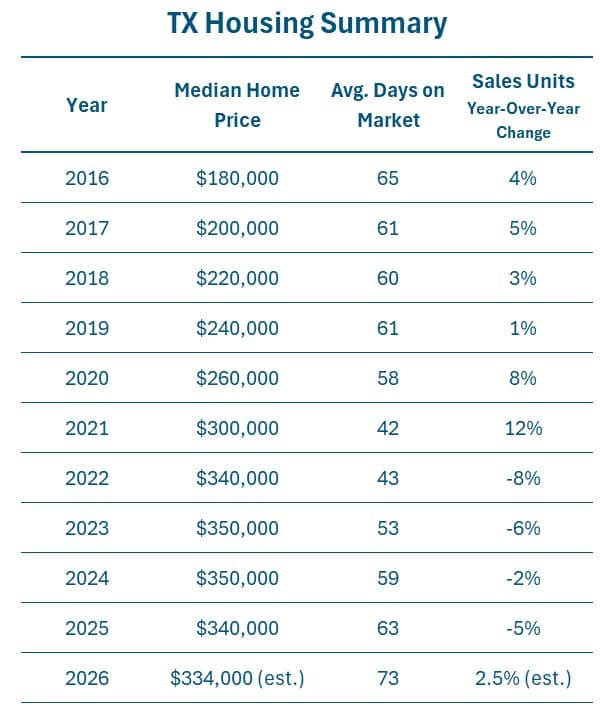
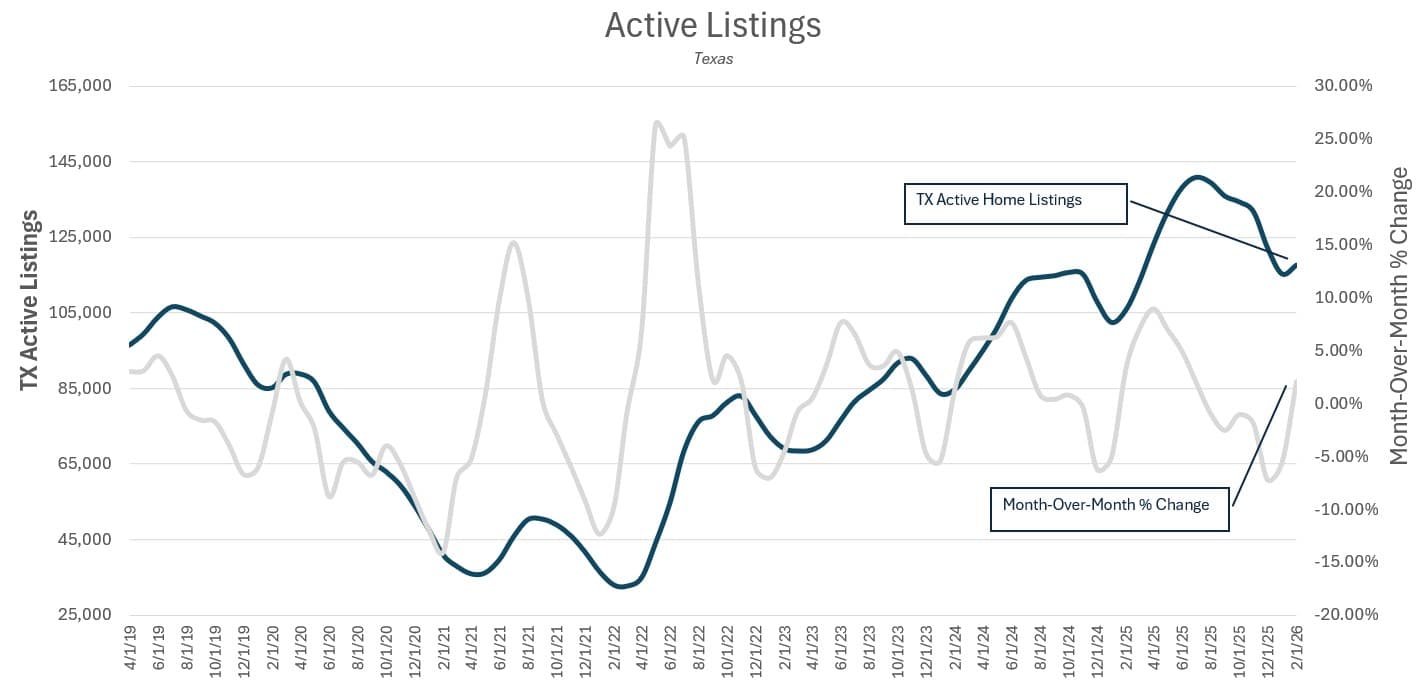
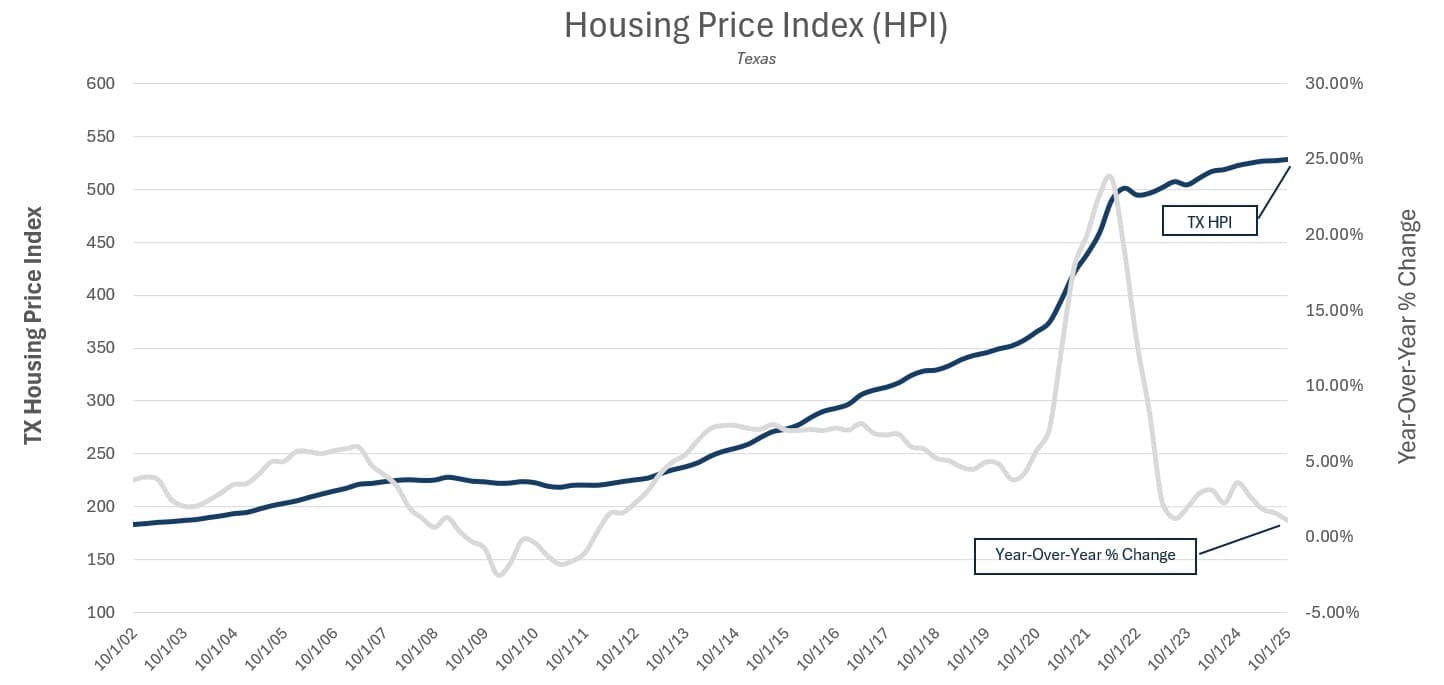
Texas has seen more pronounced cooling over the past 3 months amid robust inventory growth.  February’s median price came in at $333,800, down 1.1% year-over-year. Sales volumes softened, down roughly 4.5–5.8% year-over-year in February, continuing a trend of moderation seen since late 2025. Inventory built significantly (up 28.6% year-over-year), pushing months of supply to 5.5 in many metros and lengthening days on market to 91 days.

This has shifted most areas to clearly buyer-friendly territory, with frequent price reductions and concessions on the majority of listings. A standout hot topic is the strong new-construction boom, particularly in Dallas-Fort Worth, Houston, and Austin.

Buyer Interpretation: Take advantage of the added supply and lengthened days on market by inspecting thoroughly and requesting concessions.

Alex Logan

Brian Tilton

Owner

Email:  Brian.Tilton@IntegrityCapitalMortgage.com

Phone/Text:  (888) 853-6390

URL:  https://IntegrityCapitalMortgage.com

People Before Profits

Unsubscribe


Leave a Reply

Your email address will not be published. Required fields are marked *

Apply Now